Fig. 6.
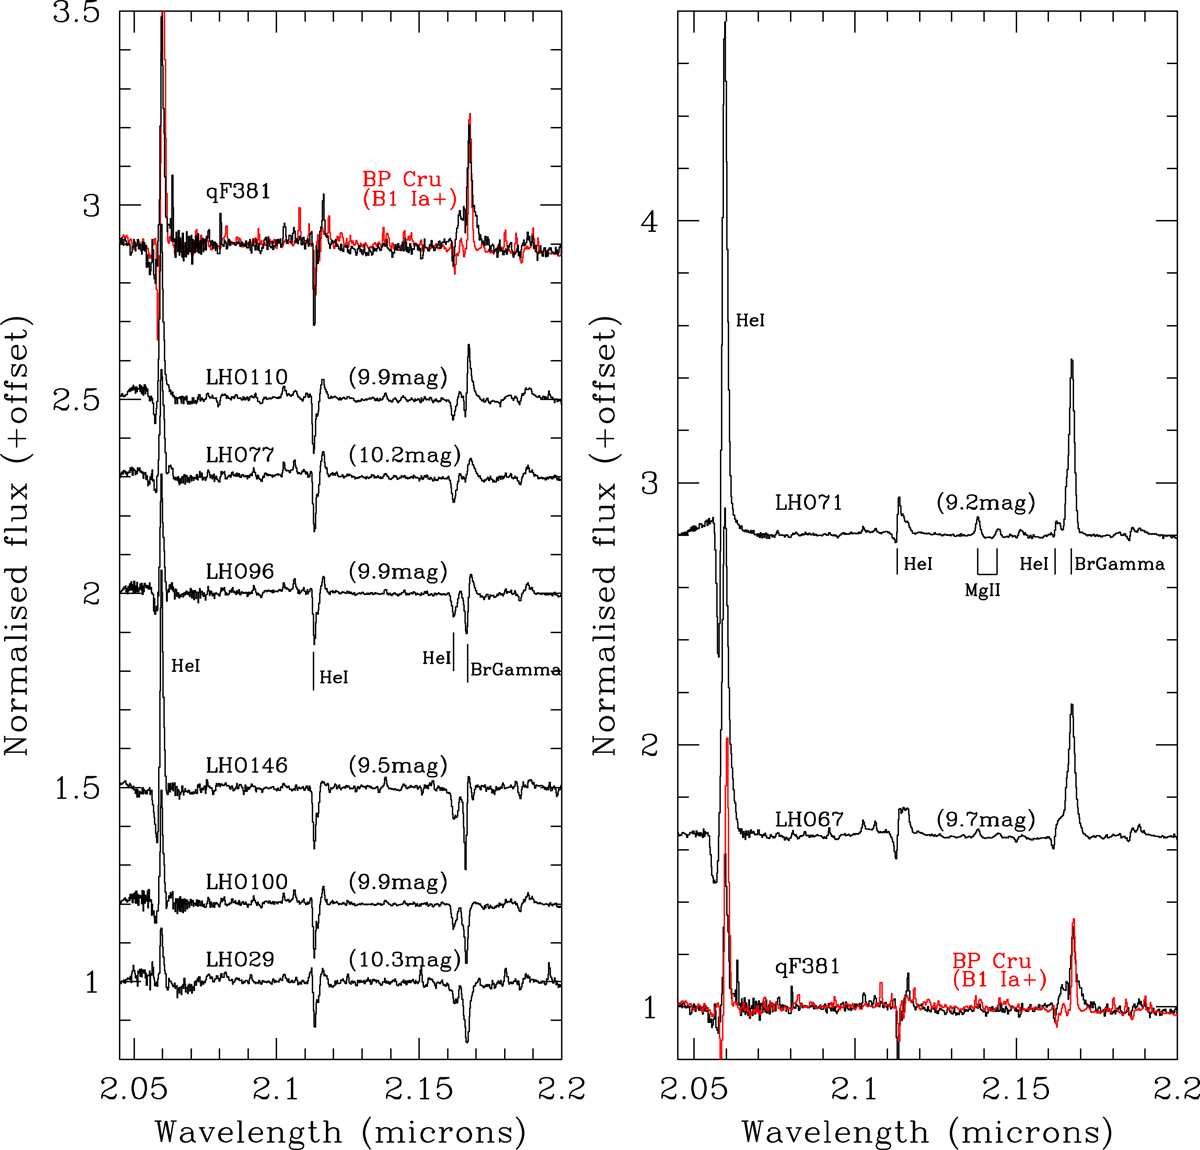
Left panel: montage of spectra of early-B hypergiants within the Quintuplet. The spectrum of the B1 Ia+ hypergiant BP Cru is provided for comparison (red; spectrum from Waisberg et al. 2017). Right panel: comparison of the B0–1 Ia+ star qF381 to the cluster WN10h star LHO67 and the WN11h star LHO71. Given the scale only prominent emission lines are shown; weaker transitions are indicated in Fig. 1. Where available HST/NICMOS F205W magnitudes are given in parentheses (Table A.1).
Current usage metrics show cumulative count of Article Views (full-text article views including HTML views, PDF and ePub downloads, according to the available data) and Abstracts Views on Vision4Press platform.
Data correspond to usage on the plateform after 2015. The current usage metrics is available 48-96 hours after online publication and is updated daily on week days.
Initial download of the metrics may take a while.