Fig. 1.
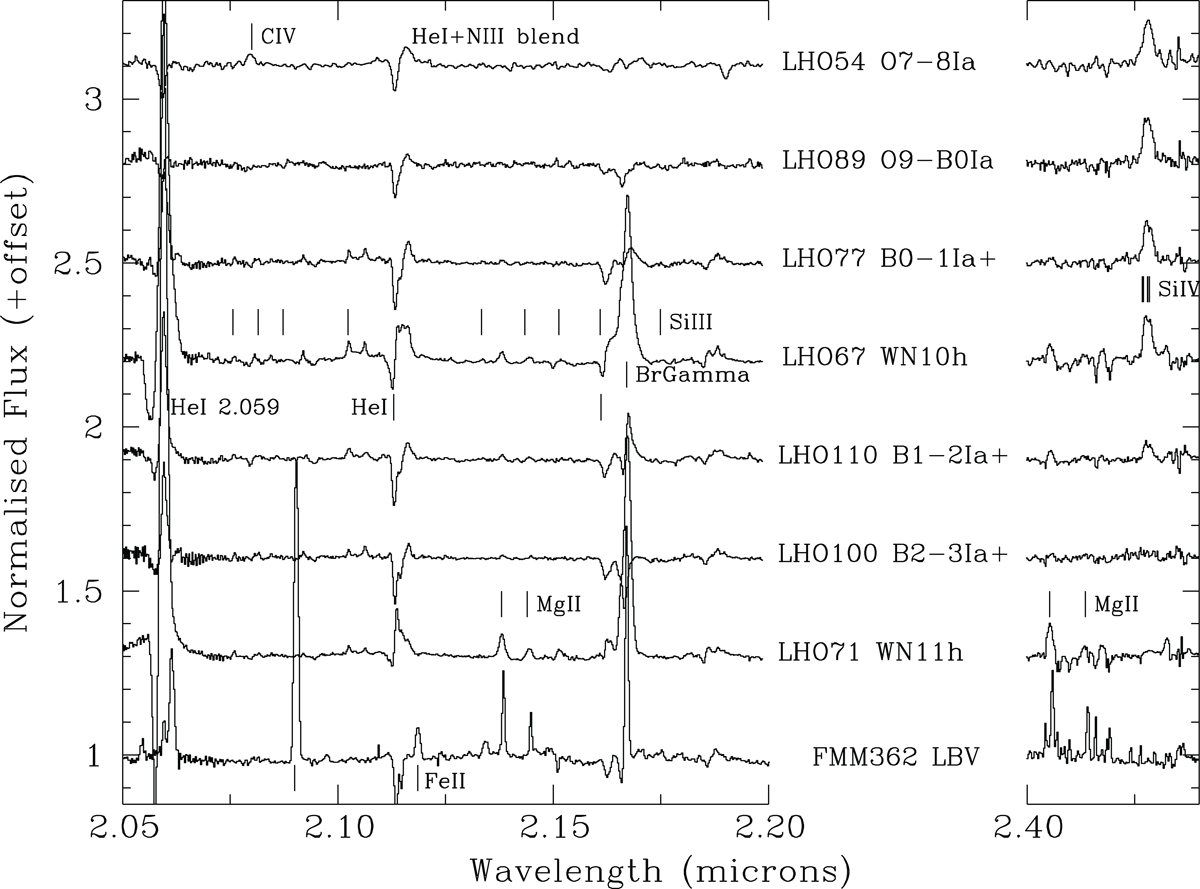
Montage of spectra of selected O supergiant, B hypergiant, WNVLh, and LBV stars to illustrate the evolution in strengths of the Si IV, Si III, and Mg II lines as a function of decreasing stellar temperature. In order to render these transitions visible, the He I2.058 μm and Brγ profiles of certain stars overlap; these are reproduced in Figs. 6 and 7. Note the appearance of pronounced emission in Fe II in the coolest star, the LBV qF362. See Sect. 3.1 for further details.
Current usage metrics show cumulative count of Article Views (full-text article views including HTML views, PDF and ePub downloads, according to the available data) and Abstracts Views on Vision4Press platform.
Data correspond to usage on the plateform after 2015. The current usage metrics is available 48-96 hours after online publication and is updated daily on week days.
Initial download of the metrics may take a while.