Fig. 5.
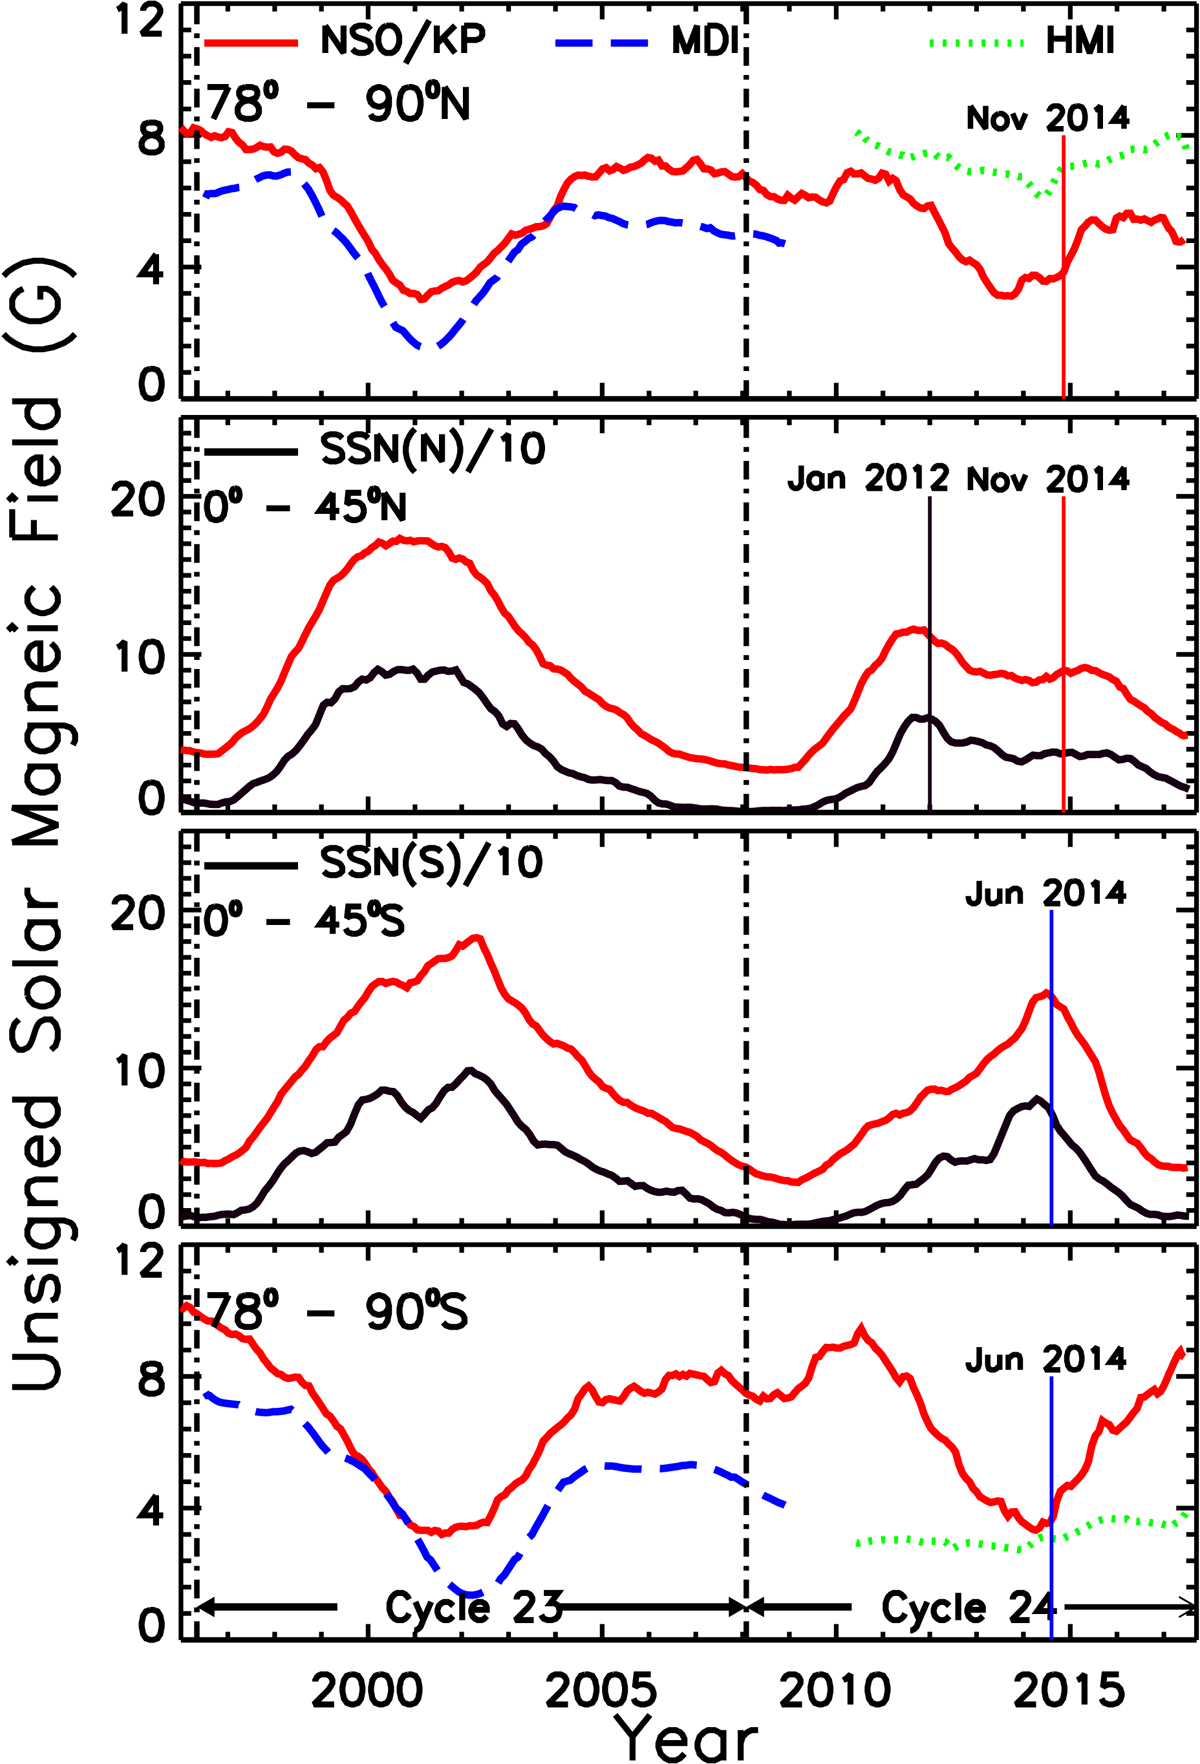
Panels (from top to bottom): unsigned values of solar magnetic fields, obtained from NSO/KP (solid curve in red), SoHO/MDI (dashed curve in blue), and HMI (dotted curve in green) magnetograms, in the latitude ranges, poleward of 78° in the north, 0°–45° in the north, 0°–45° in the south, and poleward of 78° in the south, respectively, for solar cycles 23–24. The hemispheric smoothed sunspot number is shown in solid black curve overplotted in the second (north) and third (south) panels. The hemispheric asymmetry in solar activity in cycle 24 is evident with the south showing one activity peak (Jun 2014), while the north showing double activity peaks (Jan. 2012 and Nov. 2014). It is also clear from the first and fourth panels that the polar reversal process in the north in cycle 24 is slow and seems to be completed in Nov. 2014, while in the south, it is faster and has been completed in early 2014. The occurrence and completion of polar reversal process happening around the solar cycle maximum is evident from the figure.
Current usage metrics show cumulative count of Article Views (full-text article views including HTML views, PDF and ePub downloads, according to the available data) and Abstracts Views on Vision4Press platform.
Data correspond to usage on the plateform after 2015. The current usage metrics is available 48-96 hours after online publication and is updated daily on week days.
Initial download of the metrics may take a while.