Fig. 4.
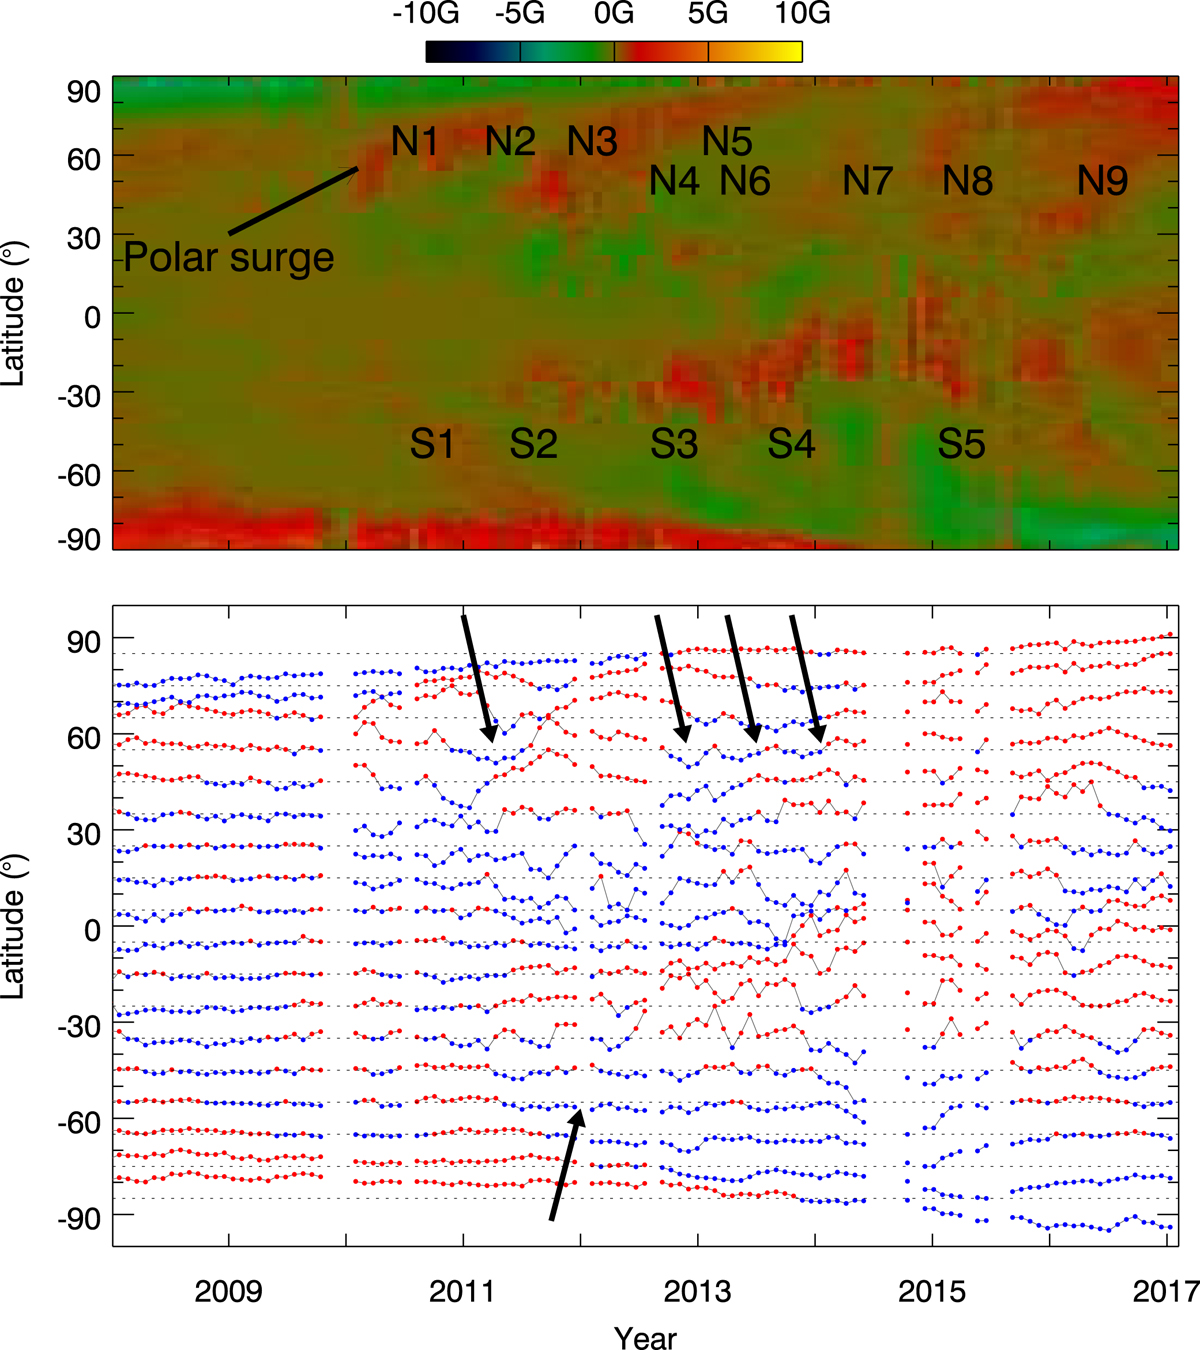
Zonally averaged magnetic diagram (upper panel) and temporal profiles of mean magnetic fields (lower panel) same as shown in Fig. 3, but only for cycle 24. The zonally averaged magnetic diagram is shown with magnetic field values saturated at 10 G. The polar surges in the north are numbered from N1 to N9, and that in the south are numbered from S1 to S5. The polarity changes in mean magnetic field profiles in the north and the south are indicated by arrows. Multiple arrows in the north indicate multiple change in polarity in the north compared to a single clean change in polarity in the south.
Current usage metrics show cumulative count of Article Views (full-text article views including HTML views, PDF and ePub downloads, according to the available data) and Abstracts Views on Vision4Press platform.
Data correspond to usage on the plateform after 2015. The current usage metrics is available 48-96 hours after online publication and is updated daily on week days.
Initial download of the metrics may take a while.