Fig. 3.
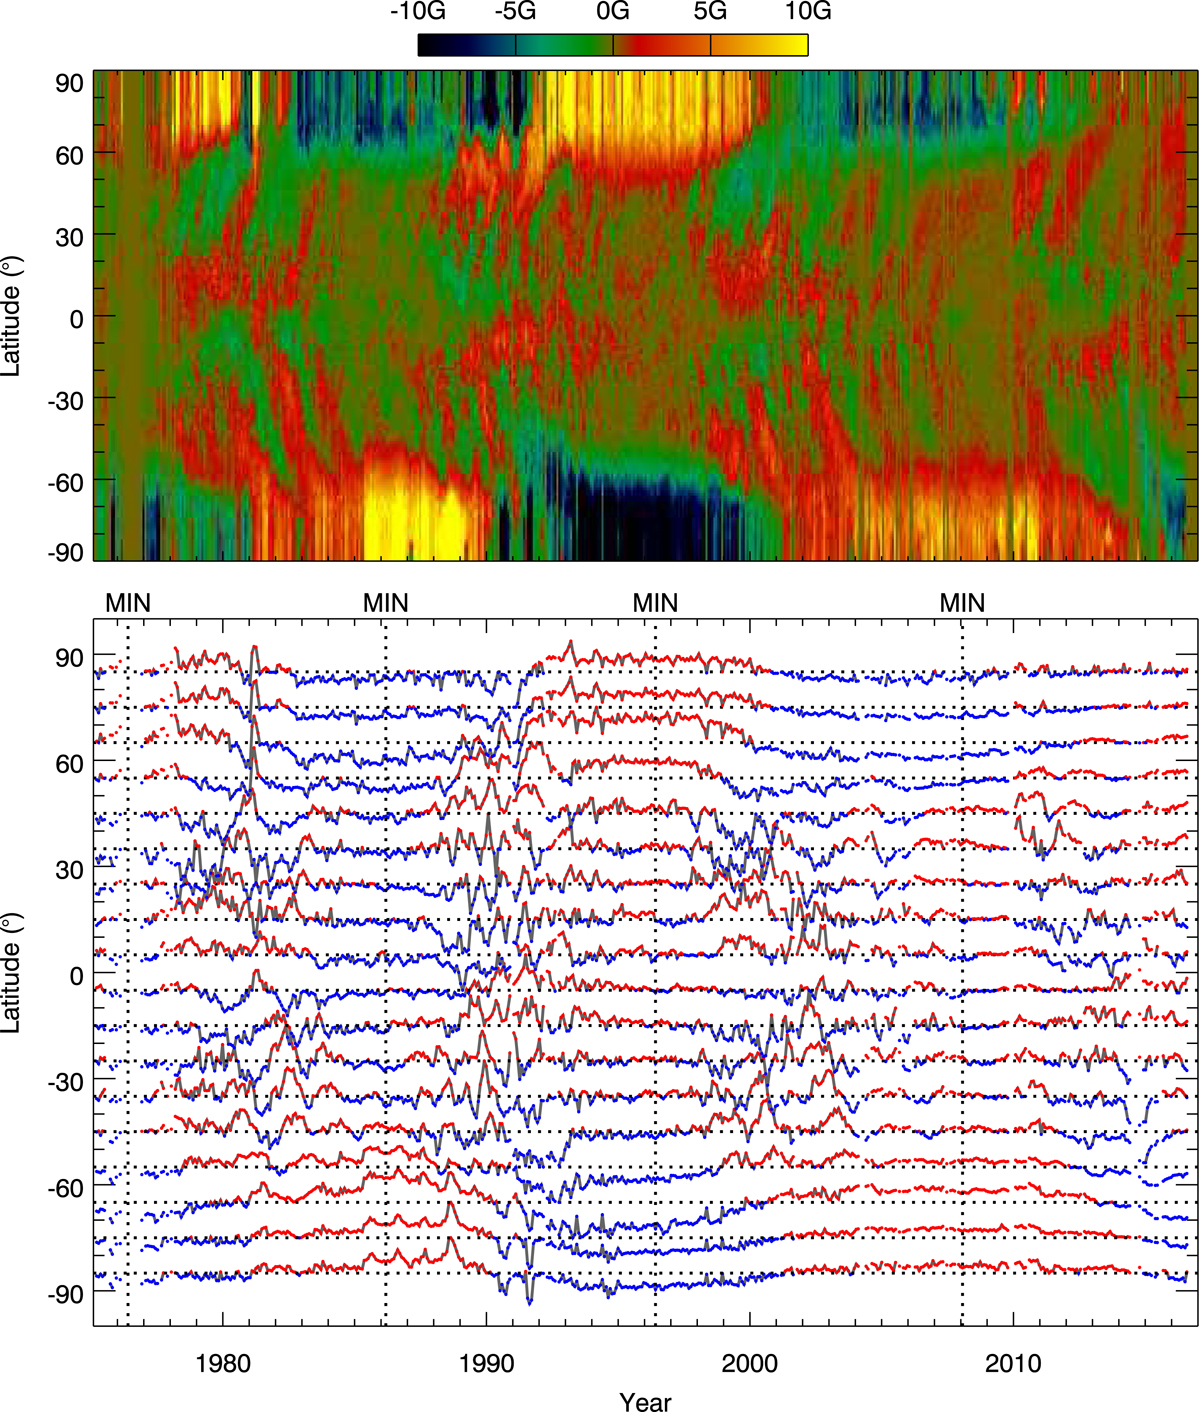
Upper panel: zonally averaged magnetic diagram produced after re-gridding individual synoptic magnetograms from sine latitude to latitude with a spatial resolution of one degree and then taking longitudinal average of the magnetic field in each latitude by using only the data points with weak magnetic field strength (|B| < 10 G) to suppress the effects of sunspots in the mid-latitudes and to reproduce the magnetic flux transport to the poles with higher contrast. Lower panel: temporal profiles of the mean magnetic field in every 10° latitude bin obtained from the butterfly diagram in the upper panel, with the red and blue points denoting positive and negative polarity, respectively.
Current usage metrics show cumulative count of Article Views (full-text article views including HTML views, PDF and ePub downloads, according to the available data) and Abstracts Views on Vision4Press platform.
Data correspond to usage on the plateform after 2015. The current usage metrics is available 48-96 hours after online publication and is updated daily on week days.
Initial download of the metrics may take a while.