Fig. 1.
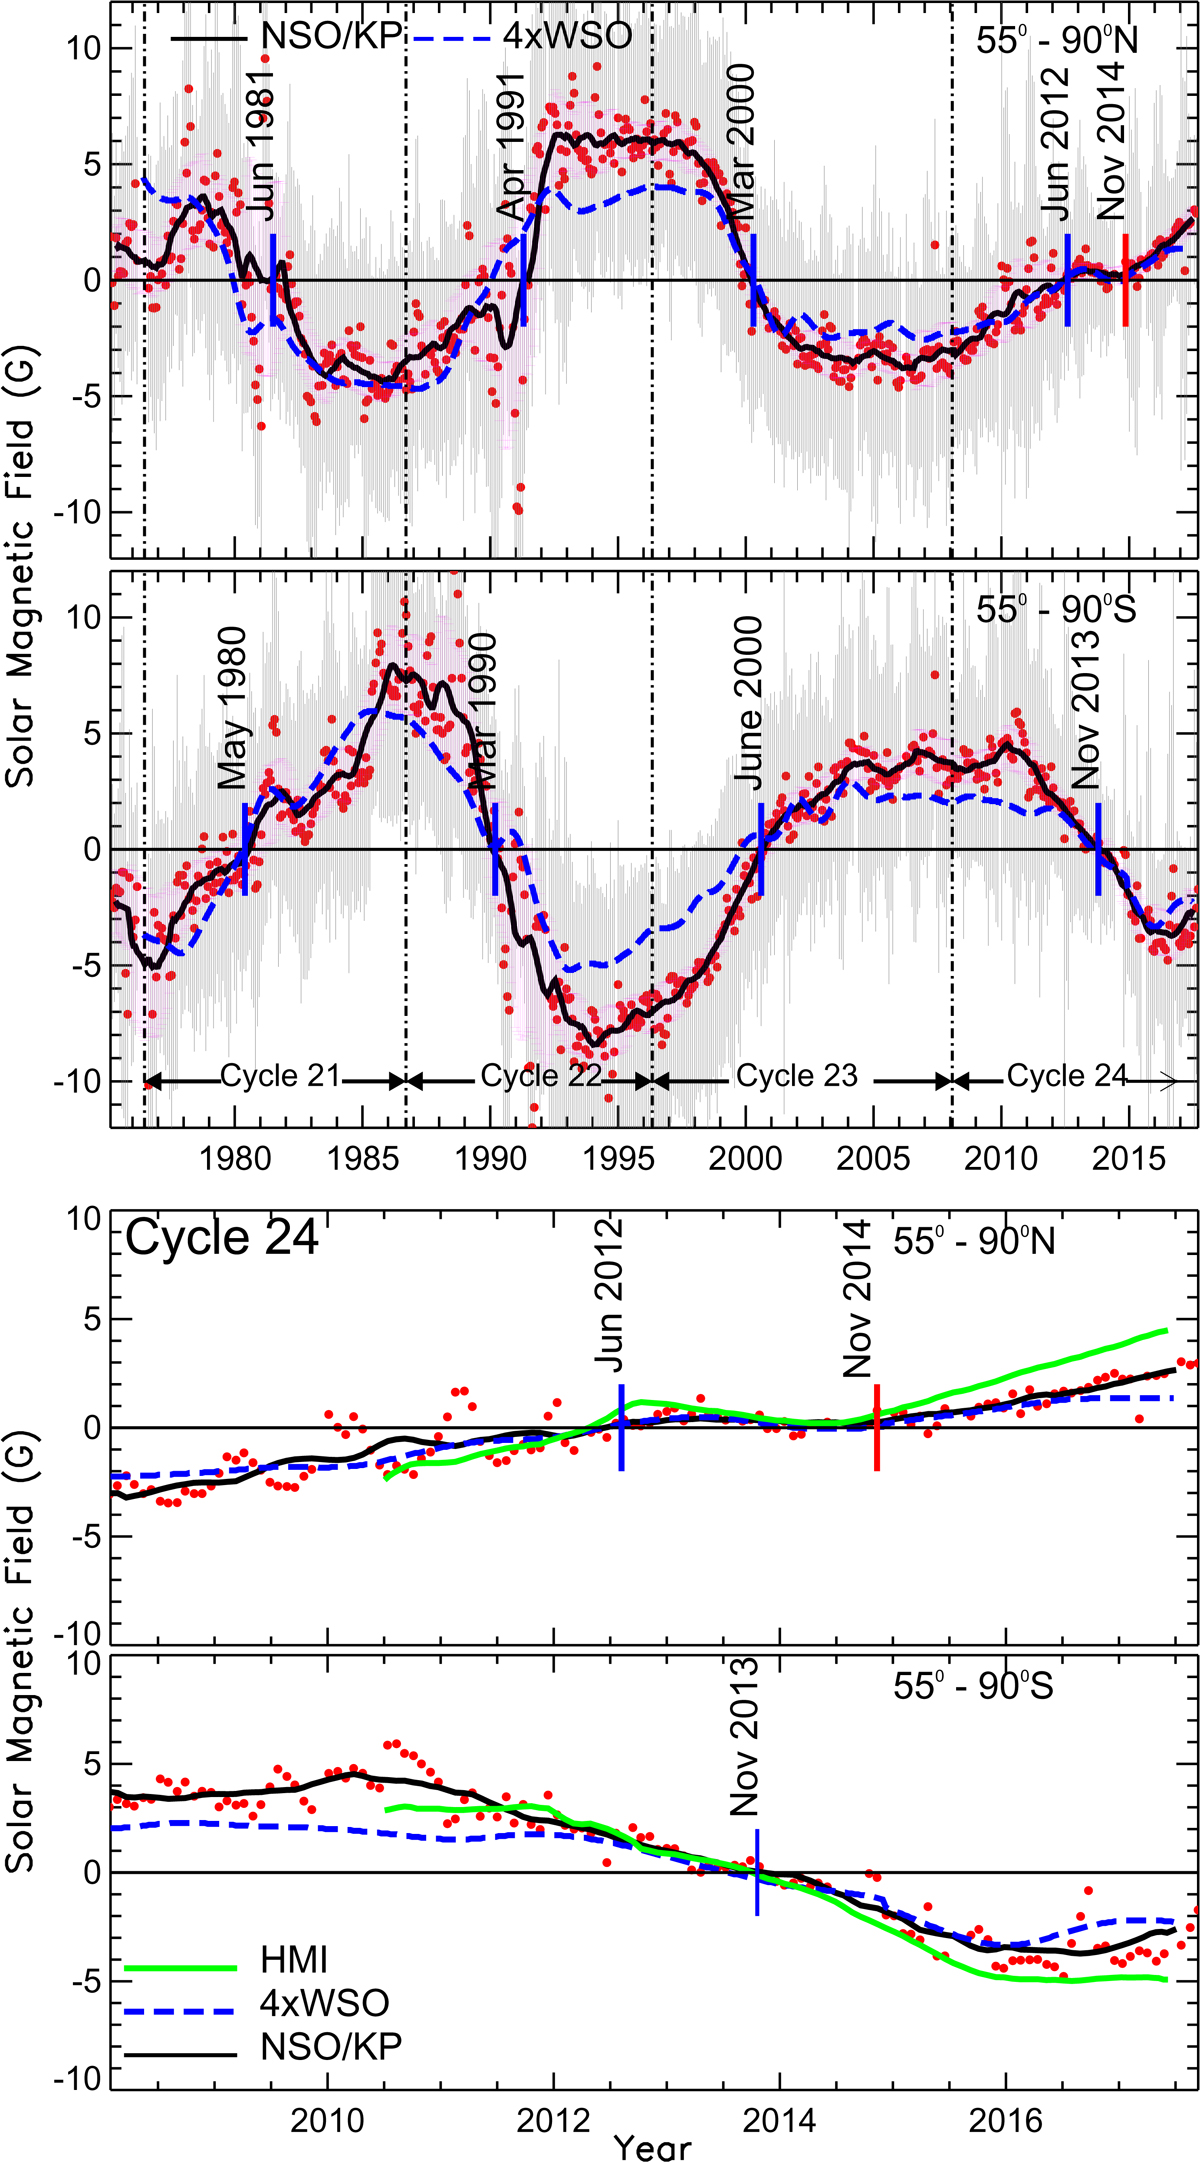
Upper two panels show, by the filled dots (red) with 1σ error bars (gray), signed values of polar field strengths from NSO/KP, in the latitude range 55°–90°, in the solar northern (top) and southern (bottom) hemispheres spanning period covering solar cycles 21–24, each of which is demarcated by vertical dashed lines. A smoothed solid black curve with 1σ error bars (pink) is drawn through the data points. Also, overplotted by a dashed blue curve is the signed values of polar field strengths from WSO. In order to eliminate yearly geometric projection effects at the poles due to the rotation of the Earth on the measured line-of-sight fields, a 1.58 year (or 20 nHz) low pass filter was used to filter WSO polar fields. The time of reversal of polarity in each hemisphere, determined from NSO/KP smoothed curve, is marked by small blue solid lines in each panel, while the time of completion of polar reversal in the solar north is indicated by a small red solid line in cycle 24. Lower two panels show only cycle 24, and to avoid clutter and enhance clarity, error bars have been left out. Overplotted by a solid green curve, in the lower two panels, is the signed values of polar field strengths from SDO/HMI. In cycle 24, the southern hemisphere underwent a clean unambiguous reversal in November 2013, while the northern hemisphere has shown an extended zero-field condition after the first reversal in June 2012. The reversal in the northern hemisphere was completed only by November 2014.
Current usage metrics show cumulative count of Article Views (full-text article views including HTML views, PDF and ePub downloads, according to the available data) and Abstracts Views on Vision4Press platform.
Data correspond to usage on the plateform after 2015. The current usage metrics is available 48-96 hours after online publication and is updated daily on week days.
Initial download of the metrics may take a while.