Fig. 9.
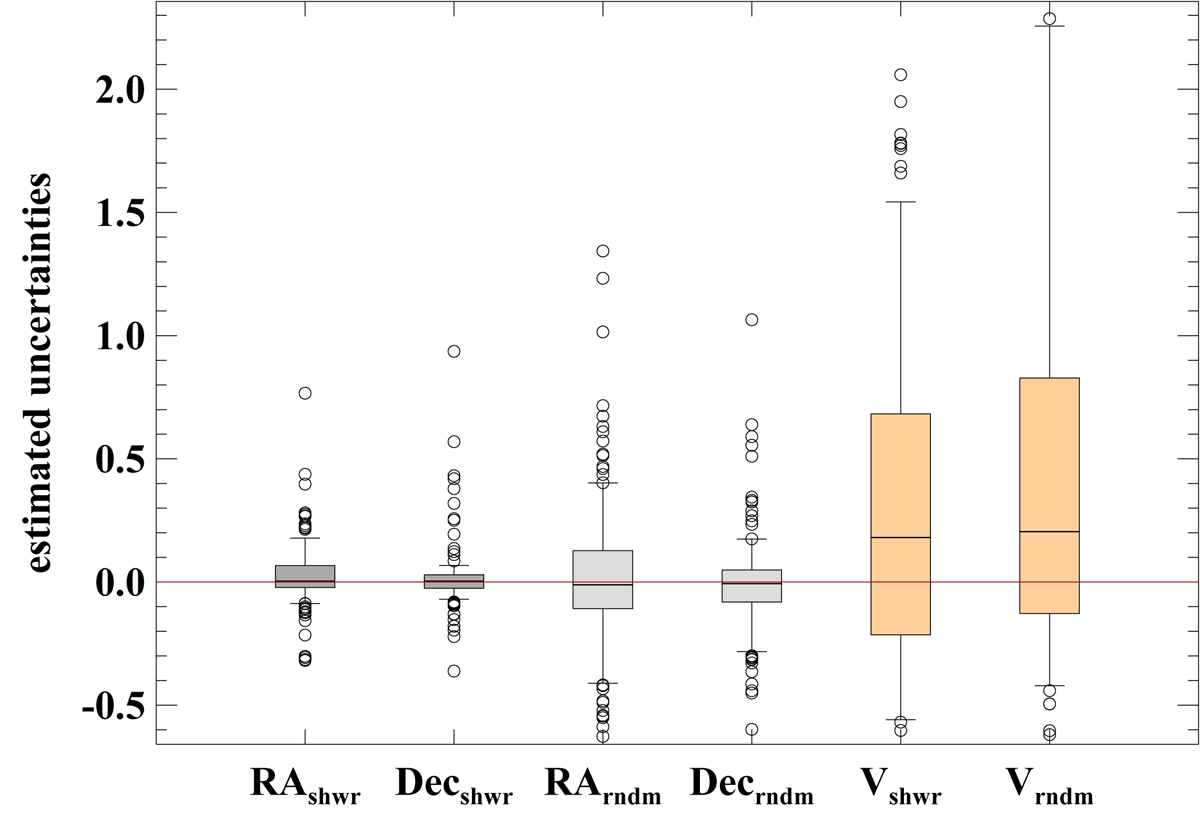
Distribution of the estimated uncertainties in RA, Dec and speed for the synthetic meteors. The length of the boxes indicates the dispersion of the data. Each box encloses 50% of the data. The extending vertical lines from the boxes indicate the range of 80% of the data with the lower and upper horizontal bars marking the 10% and 90% levels. Data outside the 80% range are shown as open circles (∘). The horizontal line inside each box indicates the median value. The units are degrees for RA and Dec, and km s−1 for speed.
Current usage metrics show cumulative count of Article Views (full-text article views including HTML views, PDF and ePub downloads, according to the available data) and Abstracts Views on Vision4Press platform.
Data correspond to usage on the plateform after 2015. The current usage metrics is available 48-96 hours after online publication and is updated daily on week days.
Initial download of the metrics may take a while.