Fig. 5.
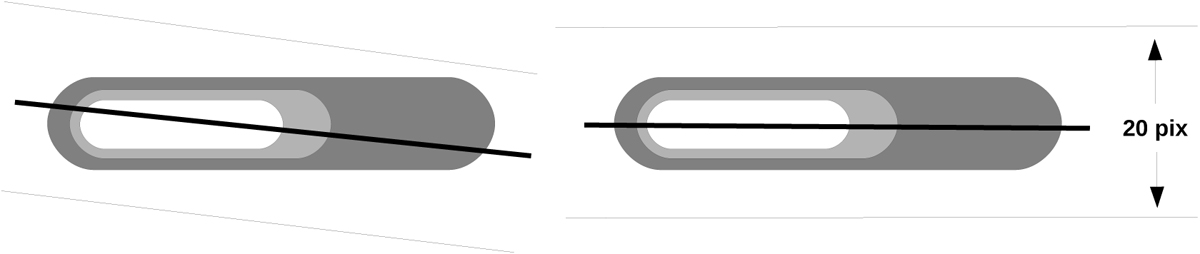
Simplified meteor example represented by three intensity levels with the dark grey area corresponding to low dn values. The line intersecting the meteor in the left example has the highest value in voting space, while the right line produces the highest ratio and it is the desired outcome. A buffer zone with a width of 20 pixel parallel to the determined line is depicted by the two parallel thin lines.
Current usage metrics show cumulative count of Article Views (full-text article views including HTML views, PDF and ePub downloads, according to the available data) and Abstracts Views on Vision4Press platform.
Data correspond to usage on the plateform after 2015. The current usage metrics is available 48-96 hours after online publication and is updated daily on week days.
Initial download of the metrics may take a while.