Fig. 4.
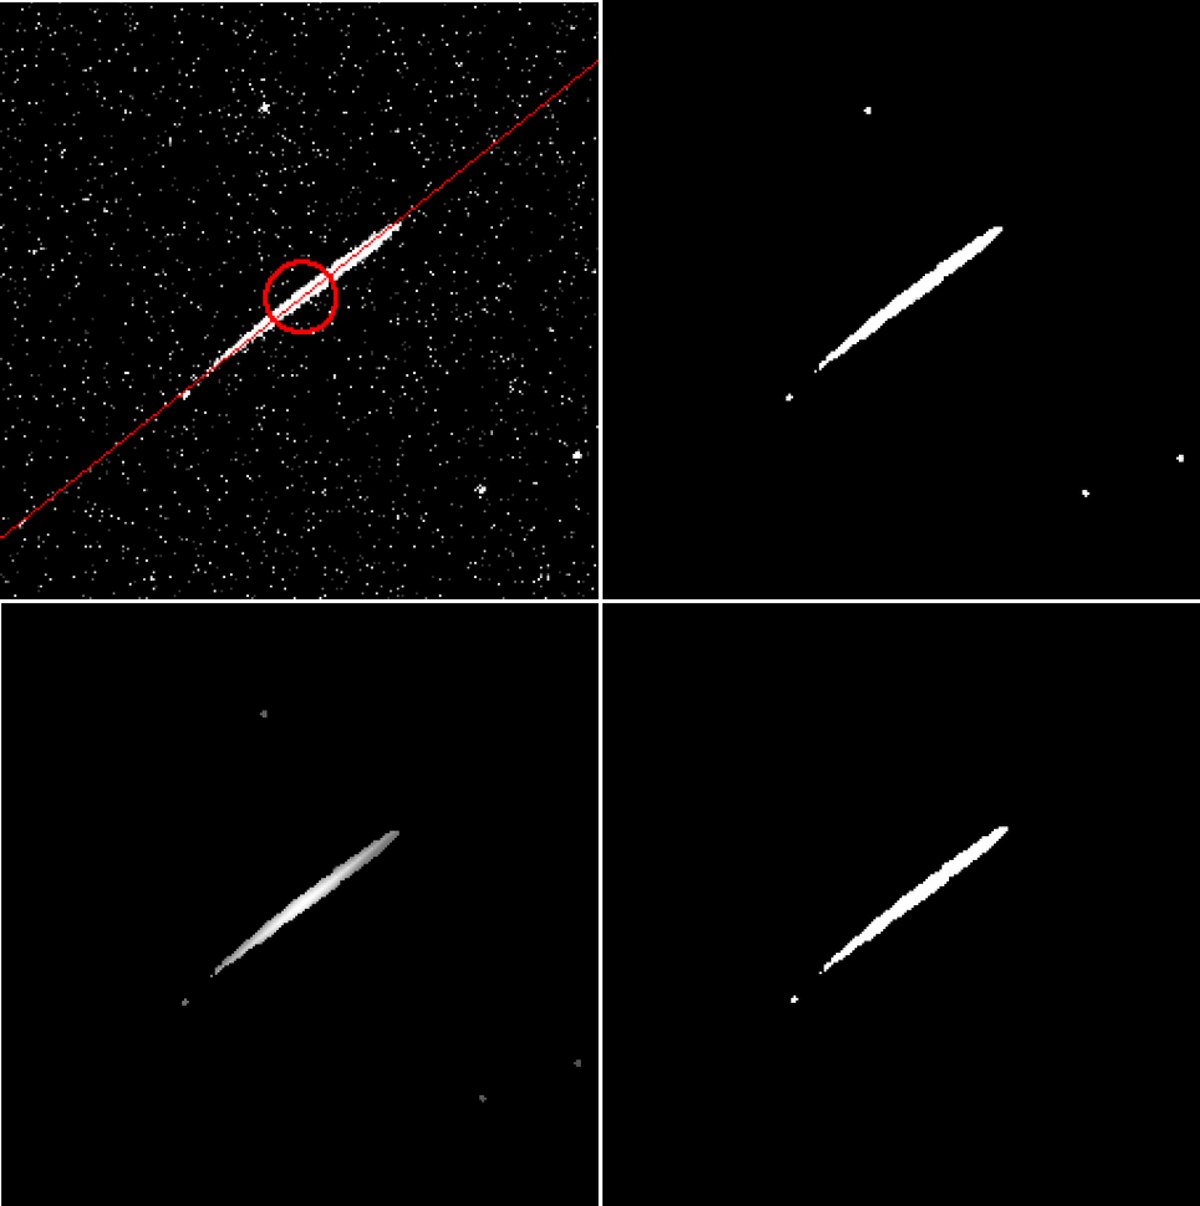
Plots showing the consecutive processing steps of a meteor image for the removal of structures not belonging to the meteor trail. From top left to lower right: detected meteor line and pixel with maximum votes (red) in thresholded image, median filter, computed coefficients for each pixel. High intensities represent meteor pixel and selected meteor pixel.
Current usage metrics show cumulative count of Article Views (full-text article views including HTML views, PDF and ePub downloads, according to the available data) and Abstracts Views on Vision4Press platform.
Data correspond to usage on the plateform after 2015. The current usage metrics is available 48-96 hours after online publication and is updated daily on week days.
Initial download of the metrics may take a while.