Free Access
Fig. 3.
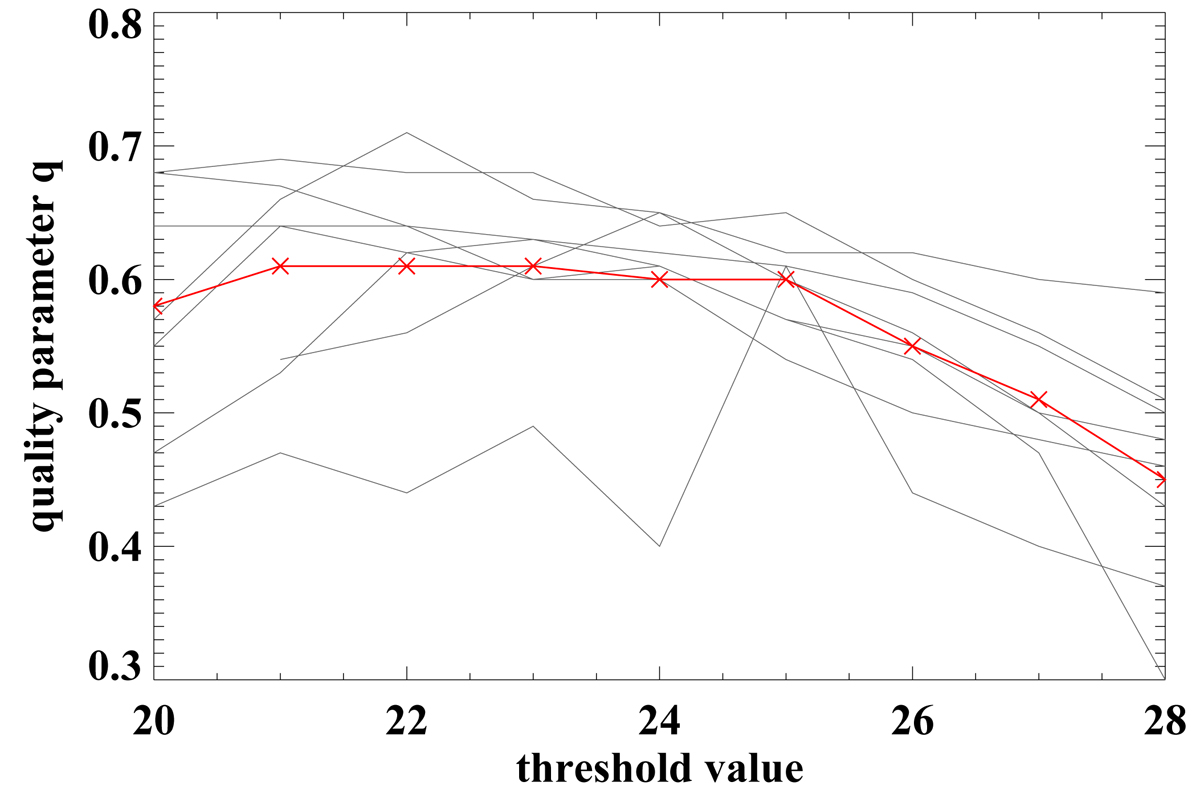
Quality parameter values computed from 8 h of image data with respect to different threshold values. The faint lines show the values of the quality parameter qm for each of the 8 datasets while the red line shows the mean value of the quality parameter for the different threshold values.
Current usage metrics show cumulative count of Article Views (full-text article views including HTML views, PDF and ePub downloads, according to the available data) and Abstracts Views on Vision4Press platform.
Data correspond to usage on the plateform after 2015. The current usage metrics is available 48-96 hours after online publication and is updated daily on week days.
Initial download of the metrics may take a while.