Free Access
Fig. 15.
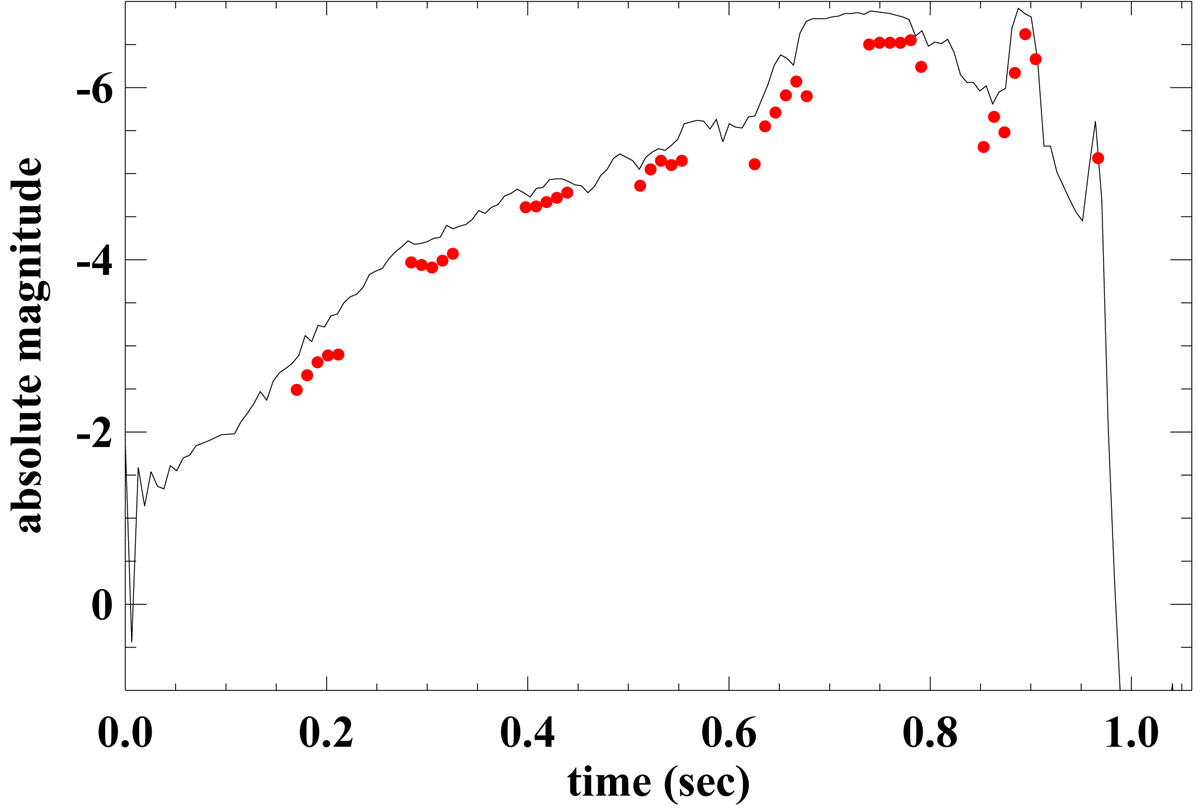
Brightness profile as a function of time for a bright Perseid meteor. The line shows the absolute magnitude calculated from the continuous meteor trail while the red dots represent brightness calculation from the shuttered meteor trail. We note the two flares at ∼0.9 s and ∼1.0 s.
Current usage metrics show cumulative count of Article Views (full-text article views including HTML views, PDF and ePub downloads, according to the available data) and Abstracts Views on Vision4Press platform.
Data correspond to usage on the plateform after 2015. The current usage metrics is available 48-96 hours after online publication and is updated daily on week days.
Initial download of the metrics may take a while.