Fig. 14.
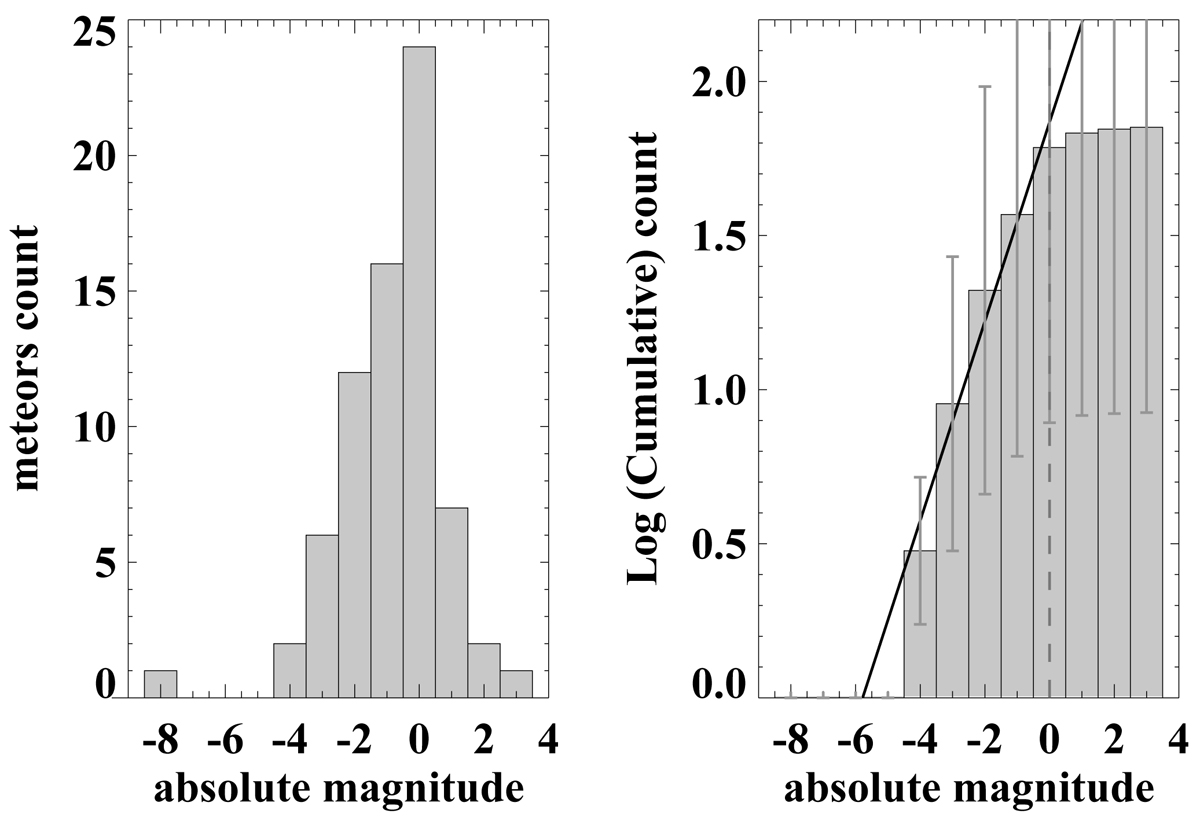
Left panel: magnitude distribution of all meteors located inside the ellipse in Fig. 12. Right panel: cumulative distribution of the magnitudes. The slope of the straight line defines the mass distribution index r for the shower during the observing time. Only meteors brighter than +0 m were included in the fit. The dashed line represents the cut-off value.
Current usage metrics show cumulative count of Article Views (full-text article views including HTML views, PDF and ePub downloads, according to the available data) and Abstracts Views on Vision4Press platform.
Data correspond to usage on the plateform after 2015. The current usage metrics is available 48-96 hours after online publication and is updated daily on week days.
Initial download of the metrics may take a while.