Fig. A.2
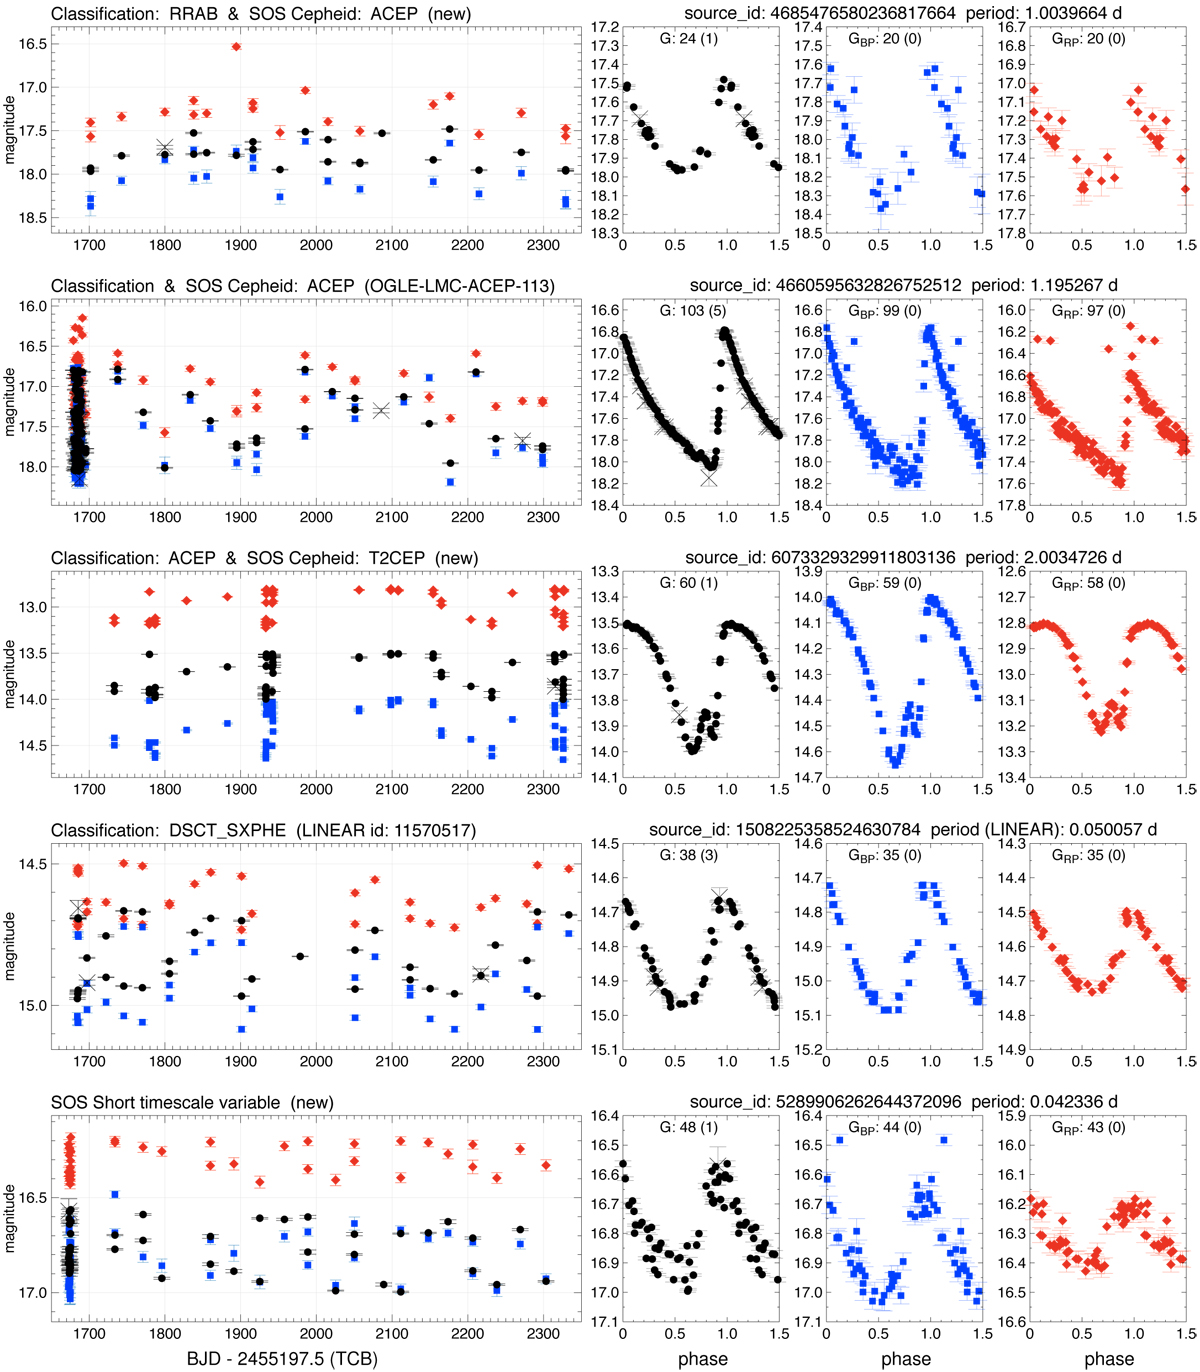
Example light curves of the Cepheid, δ Scuti star, and short-timescale variables. For each band we show the valid FoV transits, as well as variability-rejected FoV transits (number in parentheses, data plotted with crosses). In most cases, two FoV transits occur within the 6 h spin period, causing indistinguishable overlapping points in the left panels. Some outliers are not flagged in the exported data (see e.g., the GBP and GRP light curve of the ACEP example); these transits were removed in the more strict outlier rejection used in the SOS Cep and RRL module, as mentioned in Sect. 4.1. No period is published for the classification results, therefore the period for the DSCT_SXPHE example is taken from the LINEAR survey (Palaversa et al. 2013).
Current usage metrics show cumulative count of Article Views (full-text article views including HTML views, PDF and ePub downloads, according to the available data) and Abstracts Views on Vision4Press platform.
Data correspond to usage on the plateform after 2015. The current usage metrics is available 48-96 hours after online publication and is updated daily on week days.
Initial download of the metrics may take a while.