Fig. 7
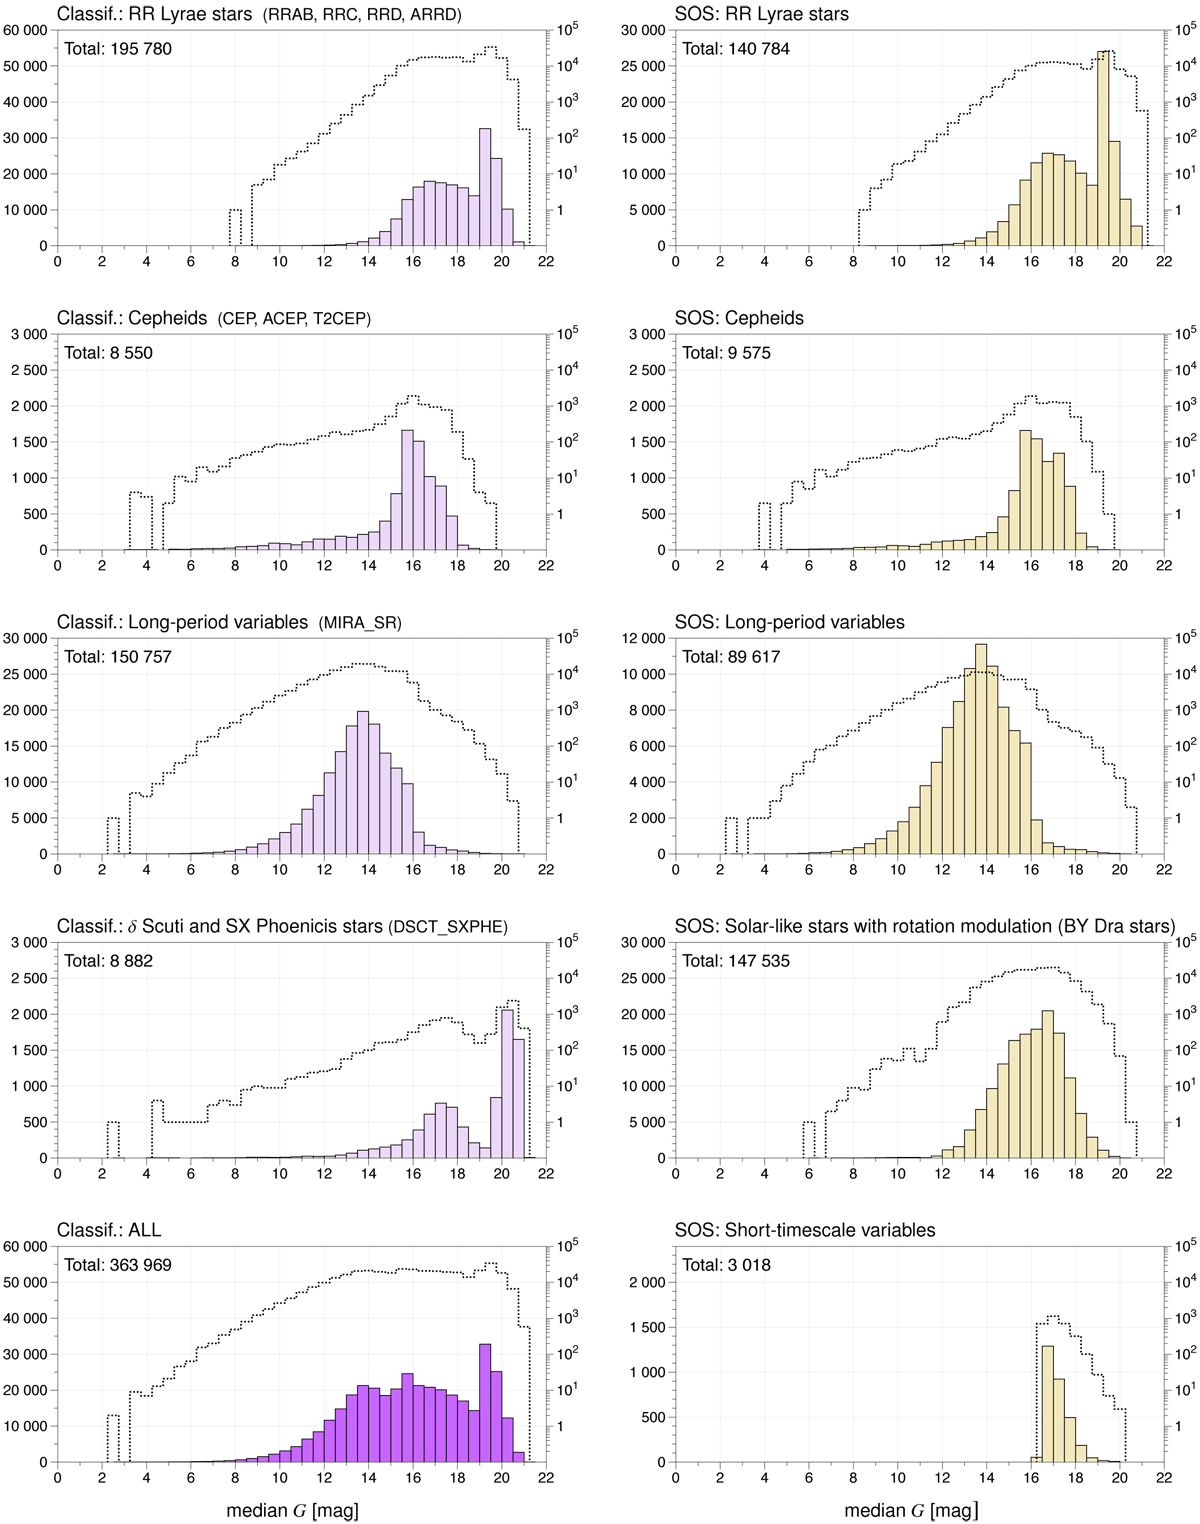
Histogram counts of the median G-band magnitude distribution of the published classification classes (left panels; see Sect. 4.3) and SOS tables (right panels; see Sect. 4.4). In the classification plots, the best_class_name entries were grouped by main type, as listed in parentheses. The filled bars correspond to the linear scale on the left side of the plots (which varies in scale), while the dotted line corresponds to the logarithmic scale on the right side of the plots (always in the same scale). The bin size is fixed to 0.5 mag.
Current usage metrics show cumulative count of Article Views (full-text article views including HTML views, PDF and ePub downloads, according to the available data) and Abstracts Views on Vision4Press platform.
Data correspond to usage on the plateform after 2015. The current usage metrics is available 48-96 hours after online publication and is updated daily on week days.
Initial download of the metrics may take a while.