Fig. 6
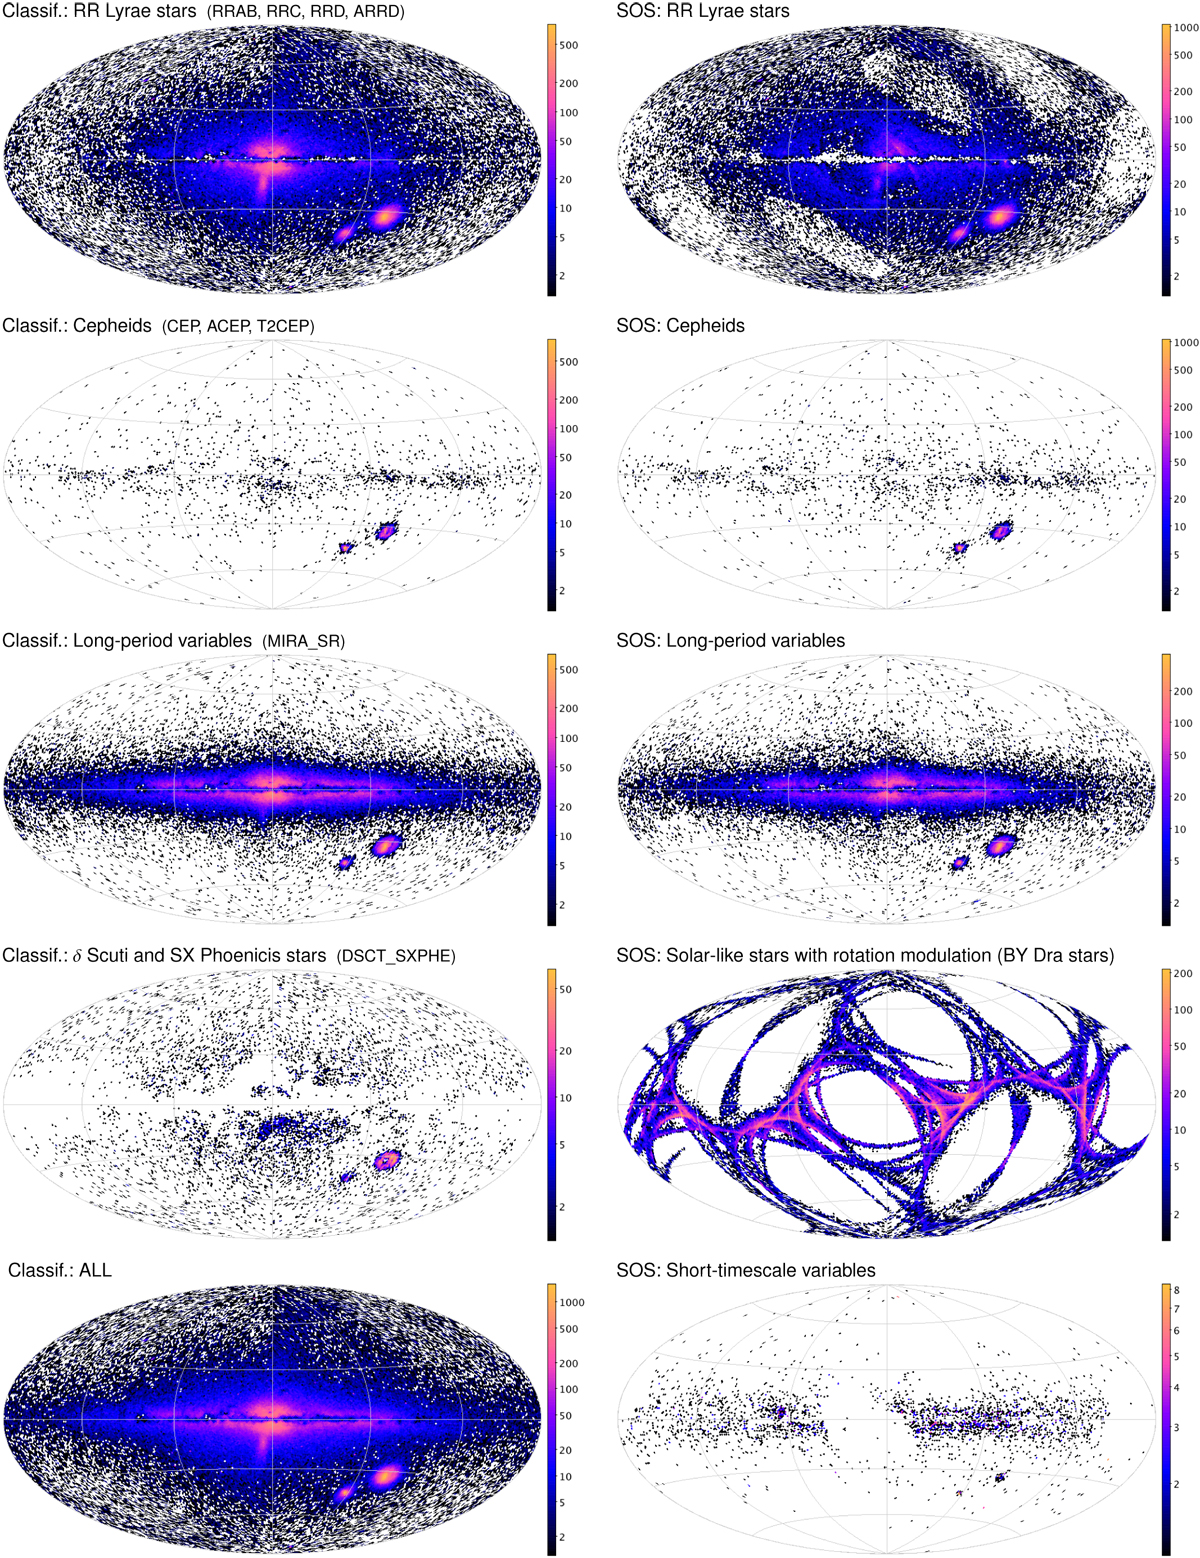
Sky source densities (count deg−2) in Galactic coordinates of the published sources in the classification table (left column; see Sect. 4.3) and SOS tables (right column; see Sect. 4.4). In the classification plots, the best_class_name entries were grouped by main type, as listed in parentheses. Galactic longitude increases to the left side.
Current usage metrics show cumulative count of Article Views (full-text article views including HTML views, PDF and ePub downloads, according to the available data) and Abstracts Views on Vision4Press platform.
Data correspond to usage on the plateform after 2015. The current usage metrics is available 48-96 hours after online publication and is updated daily on week days.
Initial download of the metrics may take a while.