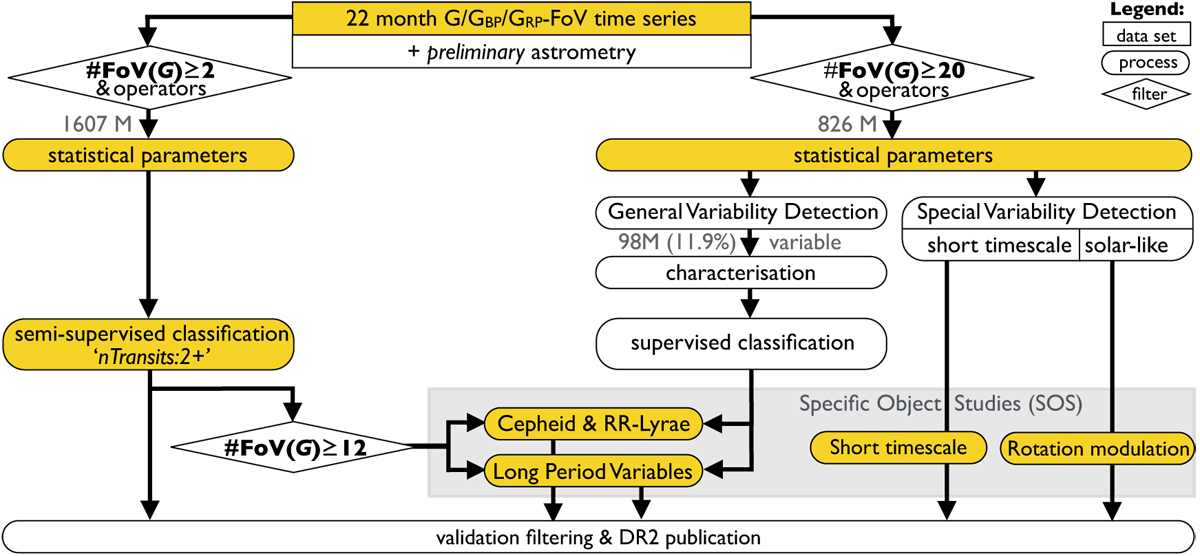
Fig. 2

DR2 variability processing overview. Data were published from the highlighted yellow boxes for the validation filtered sources. There were two main tracks: one starting from ≥ 2 G-band FoV transits (left panel), and the other from ≥20 G-band FoV transits (right panel). The former resulted in the published nTransits:2+ classifier in the vari_classifier_result table, and the latter resulted in the published SOS tables of vari_short_timescale and vari_rotation_modulation. The published SOS tables of vari_rrlyrae, vari_cepheid and vari_long_period_variable result from a mixed feed of the published nTransits:2+ classifier (for sources with at least ≥ 12 G-band FoV transits) and from the unpublished classifier of the ≥20 FoV track.
Current usage metrics show cumulative count of Article Views (full-text article views including HTML views, PDF and ePub downloads, according to the available data) and Abstracts Views on Vision4Press platform.
Data correspond to usage on the plateform after 2015. The current usage metrics is available 48-96 hours after online publication and is updated daily on week days.
Initial download of the metrics may take a while.


