Fig. 1
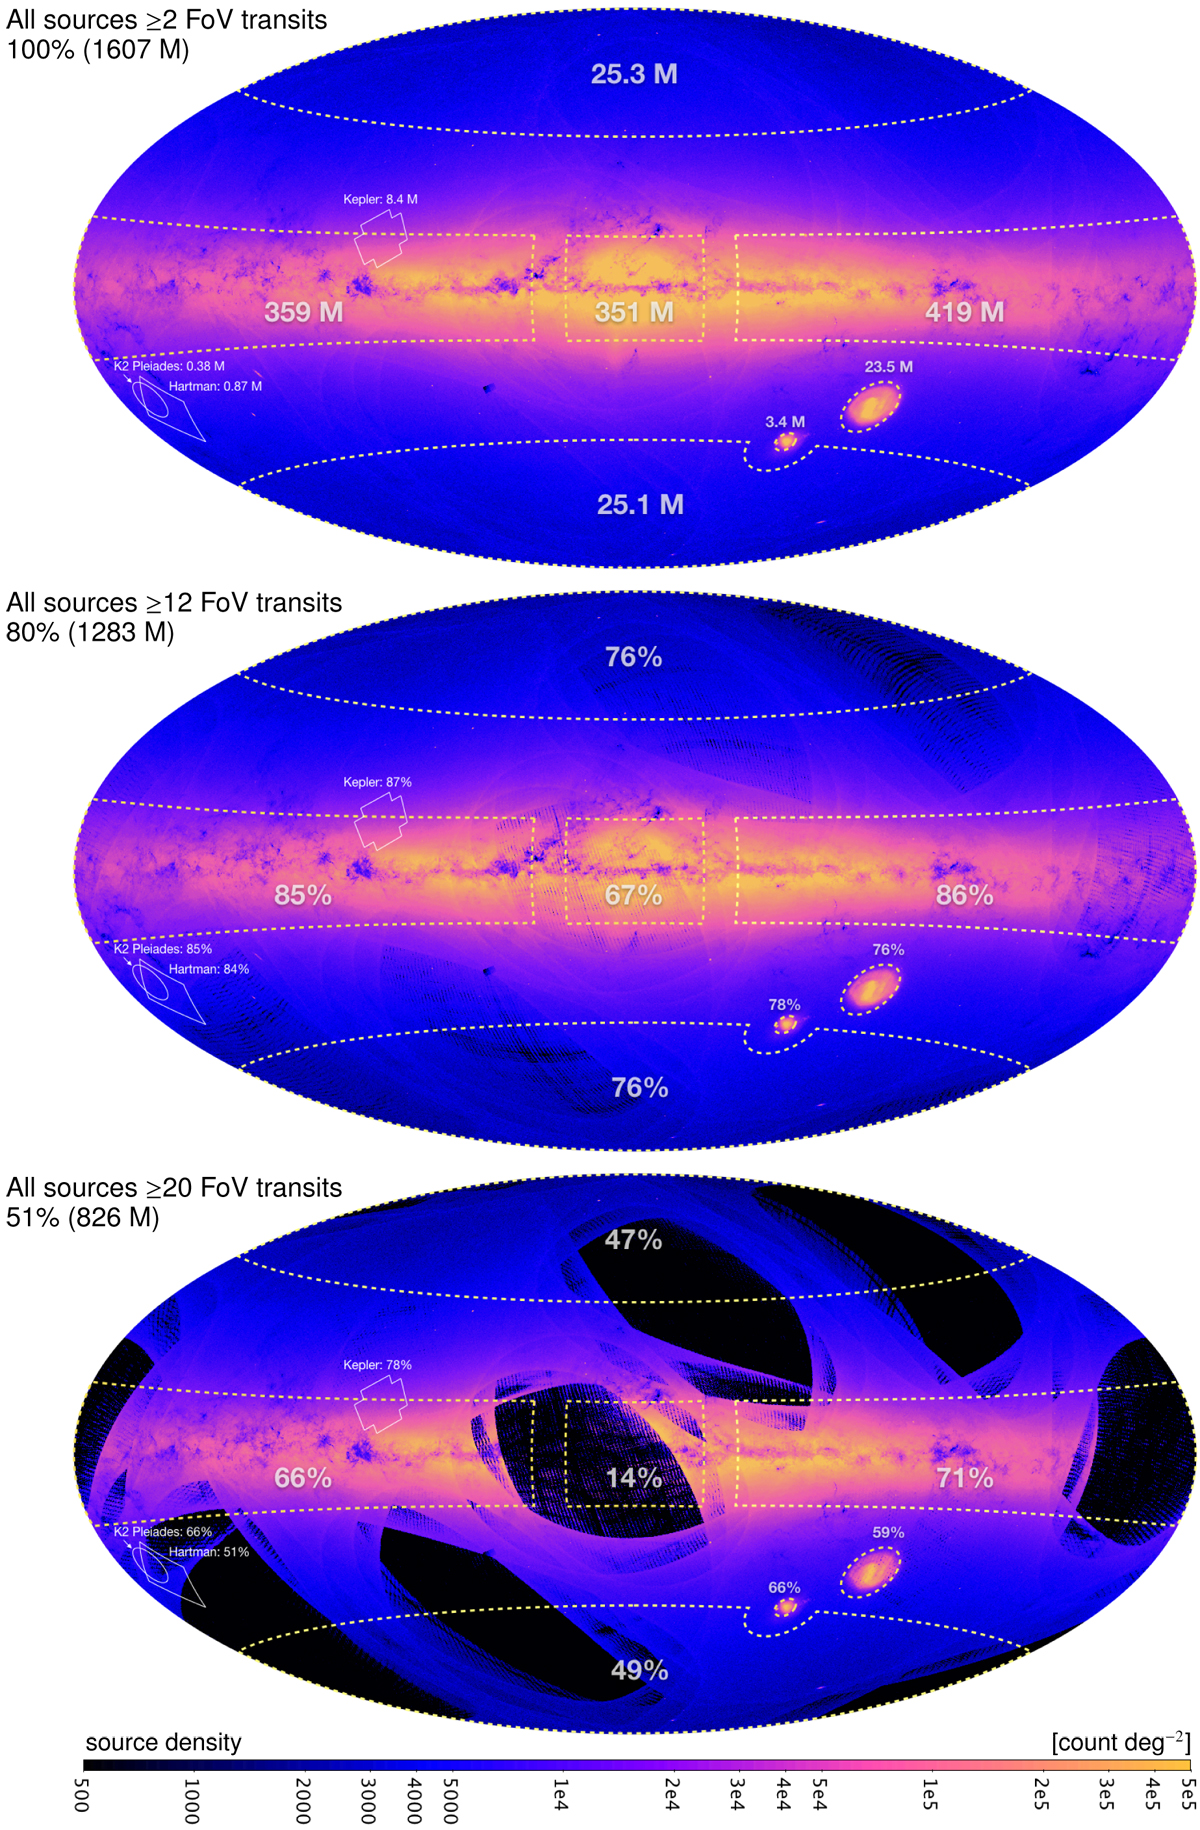
Relative source counts with respect to sources having ≥2 G-band FoV transits, illustrating the drop in relative completeness for source sets with ≥12 and ≥20 G-band FoV transits, as applied in our processing (see Fig. 2). Regional values are listed in Table 1 and discussed in Sect. 2.1. Values for external catalogs are Gaia source counts in the approximate sky footprint, not source cross-match counts. Note that actual time series are published only for the 550 K variable sources in DR2 (see Fig. 3).
Current usage metrics show cumulative count of Article Views (full-text article views including HTML views, PDF and ePub downloads, according to the available data) and Abstracts Views on Vision4Press platform.
Data correspond to usage on the plateform after 2015. The current usage metrics is available 48-96 hours after online publication and is updated daily on week days.
Initial download of the metrics may take a while.