Fig. 9.
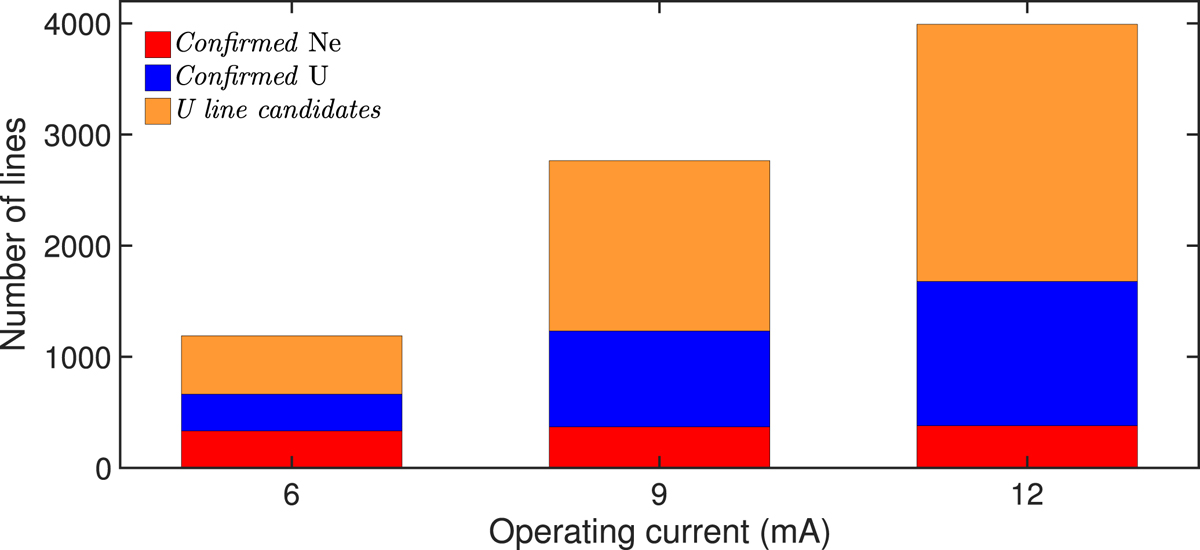
Number of lines in the spectra recorded when the U–Ne HCL was operated at 6, 9, and 12 mA using the VIS setup (from 500 to 1000 nm). The subset of confirmed U lines (with a corresponding line in the literature) is shown in blue. The subset of confirmed Ne lines is shown in red. We show the number of U line candidates in orange (line candidates with line width comparable to the FWHM of the confirmed U lines and with no match in the literature).
Current usage metrics show cumulative count of Article Views (full-text article views including HTML views, PDF and ePub downloads, according to the available data) and Abstracts Views on Vision4Press platform.
Data correspond to usage on the plateform after 2015. The current usage metrics is available 48-96 hours after online publication and is updated daily on week days.
Initial download of the metrics may take a while.