Free Access
Fig. 8.
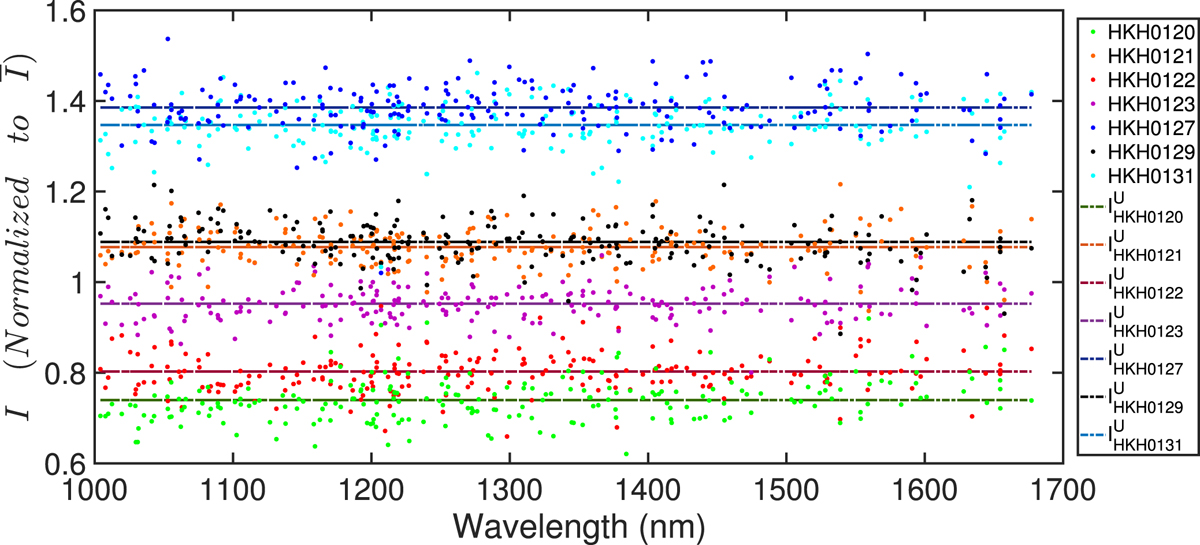
Coloured dots represent the normalized line intensity of 222 UI lines for each HCL in the spectral range from 1000 to 1700 nm. Dashed coloured lines indicate ![]() of each lamp (i.e. average of the 222 UI normalized line intensity). For readability reasons we plot only seven of the 12 HCLs.
of each lamp (i.e. average of the 222 UI normalized line intensity). For readability reasons we plot only seven of the 12 HCLs.
Current usage metrics show cumulative count of Article Views (full-text article views including HTML views, PDF and ePub downloads, according to the available data) and Abstracts Views on Vision4Press platform.
Data correspond to usage on the plateform after 2015. The current usage metrics is available 48-96 hours after online publication and is updated daily on week days.
Initial download of the metrics may take a while.