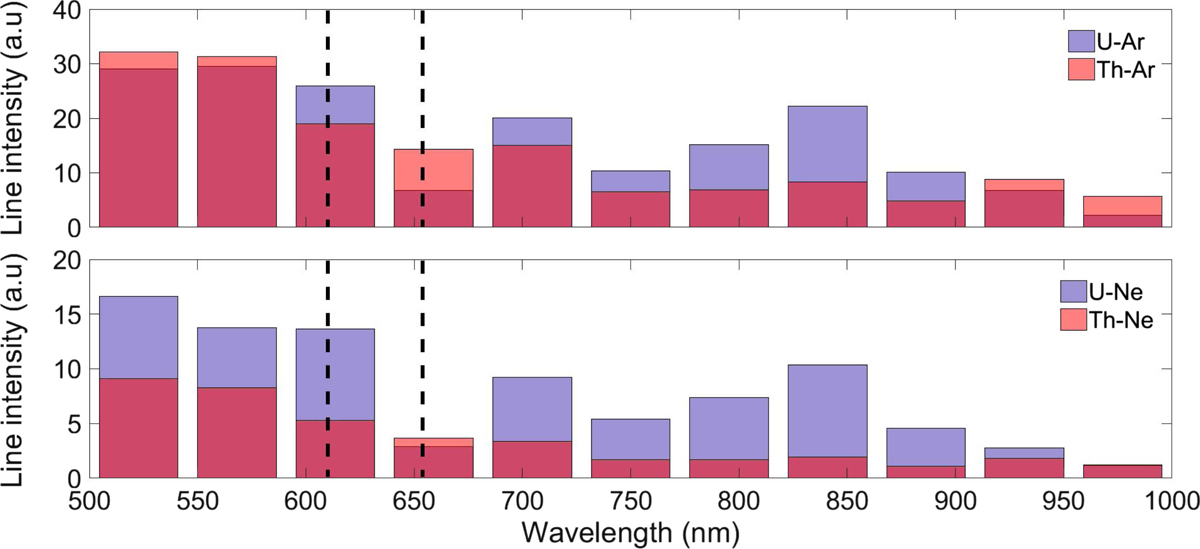
Fig. 5.

Total line intensity of metal lines per 45 nm in VIS setup. Blue bars represent the total line intensity per spectral range of U lines and red represents Th lines. Magenta indicates the overlap areas. The spectral region between the dashed lines (from 610 to 655 nm) indicates where the internal laser of our FTS contaminates the recorded spectra. Upper panel: HCLs with Ar buffer gas (U–Ar and Th–Ar). Bottom panel: HCLs with Ne buffer gas (U–Ne and Th–Ne).
Current usage metrics show cumulative count of Article Views (full-text article views including HTML views, PDF and ePub downloads, according to the available data) and Abstracts Views on Vision4Press platform.
Data correspond to usage on the plateform after 2015. The current usage metrics is available 48-96 hours after online publication and is updated daily on week days.
Initial download of the metrics may take a while.


