Fig. 4.
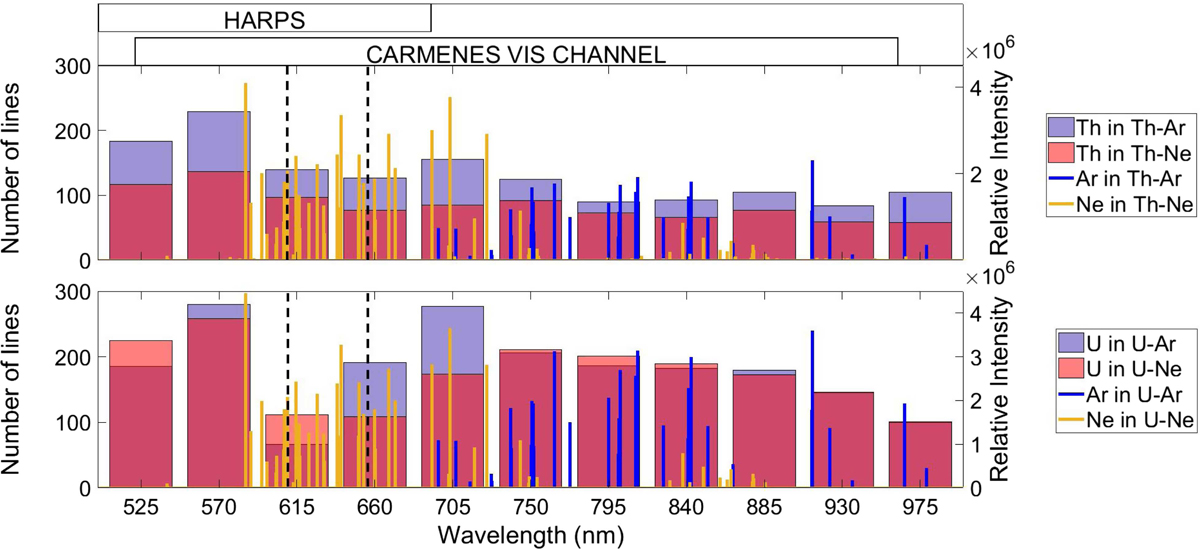
Number of metal lines per 45 nm (light blue for Ar buffer gas HCLs and light red for Ne buffer gas lamps) using VIS setup. The area where both overlap is represented in magenta. The high intensity gas lines (i.e. gas lines with intensities higher than the most intense metal line) are overplotted. Argon lines are represented in blue and Ne lines in orange. In the top part, we indicate the spectral range covered by the CARMENES VIS channel and HARPS (Mayor et al. 2003). The spectral region between the dashed lines (from 610 to 655 nm) indicates where the internal laser of our FTS contaminates the recorded spectra. Upper panel: Th cathode HCLs (Th–Ne and Th–Ar). Lower panel: U cathode HCLs (U–Ne and U–Ar). Top part of the plot shows the spectral range coverage of high resolution astronomical spectrographs. The spectral region within the dashed lines indicates where the line identification is affected by the internal FTS laser (see Sect. 2).
Current usage metrics show cumulative count of Article Views (full-text article views including HTML views, PDF and ePub downloads, according to the available data) and Abstracts Views on Vision4Press platform.
Data correspond to usage on the plateform after 2015. The current usage metrics is available 48-96 hours after online publication and is updated daily on week days.
Initial download of the metrics may take a while.