Fig. A.2.
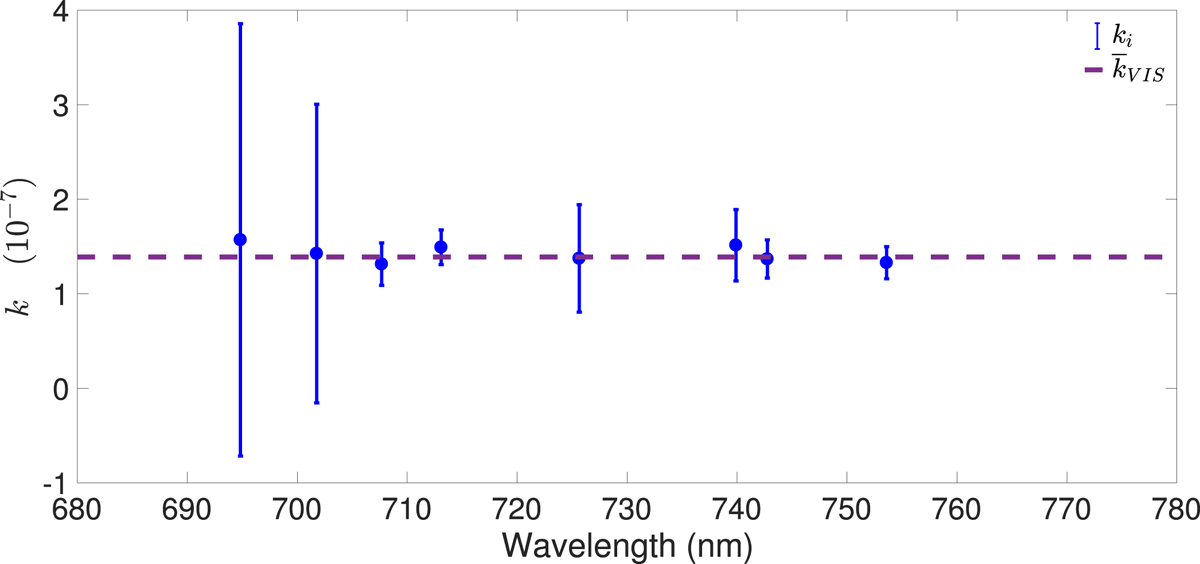
FTS k factor used to obtain an absolute wavelength calibration of the spectra recorded from 500 to 1000 nm. We use eight U standard lines from Degraffenreid & Sansonetti (2002) that have a match in our spectrum. The blue dots indicate the ki of each line. The error bars indicate the uncertainty calculated by error propagation of the line position measurement of our lines and the standard lines. The dashed purple line indicates the weighted average of the 8 ki.
Current usage metrics show cumulative count of Article Views (full-text article views including HTML views, PDF and ePub downloads, according to the available data) and Abstracts Views on Vision4Press platform.
Data correspond to usage on the plateform after 2015. The current usage metrics is available 48-96 hours after online publication and is updated daily on week days.
Initial download of the metrics may take a while.