Fig. A.1.
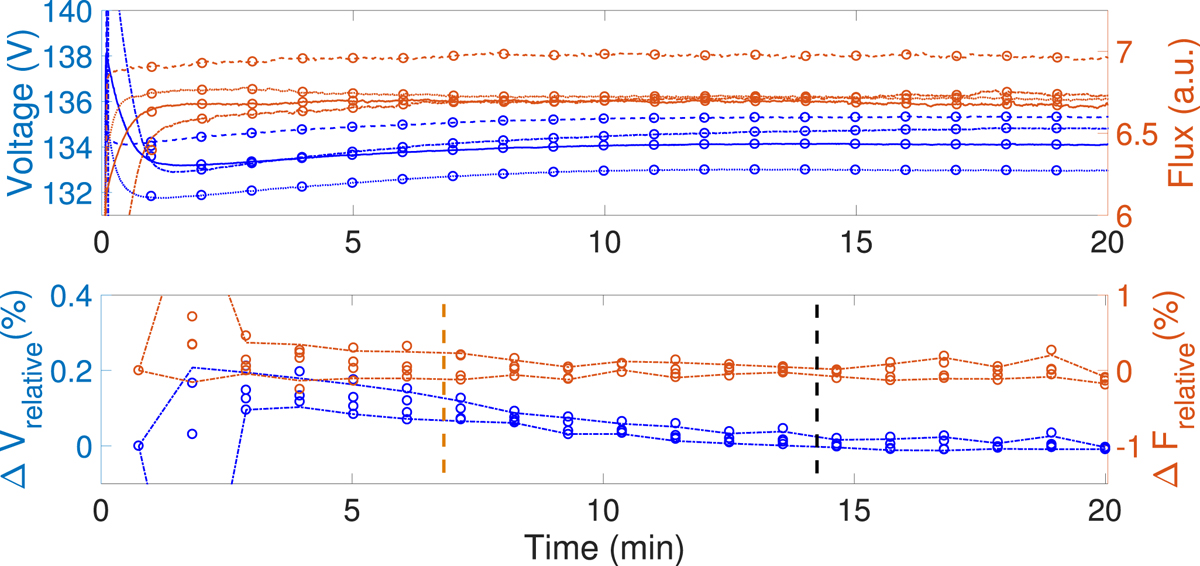
Voltage and flux measurement during warm-up time of the four different HCLs. Upper panel: the blue lines indicate voltage measurements (y-axis in the left) and the brown lines represent the flux (y-axis in the right). Blue and brown circles indicate the one minute average values. Bottom panel: the left axis indicates the relative voltage variation, and the right axis the relative flux variation. Blue and brown circles represent voltage and flux respectively. Blue and brown lines indicate ±σ of the calculated relative variation for voltage and flux. The brown dashed vertical line (at about seven minutes) indicates when the flux reaches a stability of 0.5% for all the lamps. The black vertical dashed line indicates when the voltage is stable with relative changes lower than 0.05%. We consider that the lamps offer their most stable output after 14–15 min.
Current usage metrics show cumulative count of Article Views (full-text article views including HTML views, PDF and ePub downloads, according to the available data) and Abstracts Views on Vision4Press platform.
Data correspond to usage on the plateform after 2015. The current usage metrics is available 48-96 hours after online publication and is updated daily on week days.
Initial download of the metrics may take a while.