Free Access
Fig. 14.
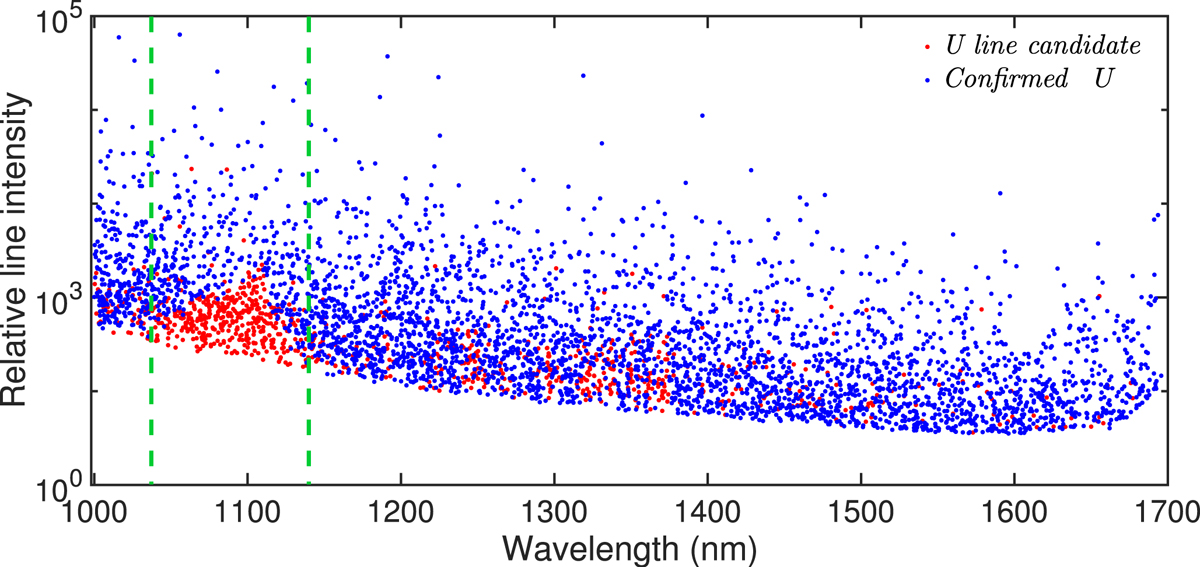
Relative line intensity of the U line candidates (red dots) and the confirmed U lines (blue dots) as a function of wavelength. The green dashed lines indicate the spectral band from 1031 to 1139 nm, where the R2011 line list shows a lack of emision lines caused by the spectral response of its spectrograph.
Current usage metrics show cumulative count of Article Views (full-text article views including HTML views, PDF and ePub downloads, according to the available data) and Abstracts Views on Vision4Press platform.
Data correspond to usage on the plateform after 2015. The current usage metrics is available 48-96 hours after online publication and is updated daily on week days.
Initial download of the metrics may take a while.