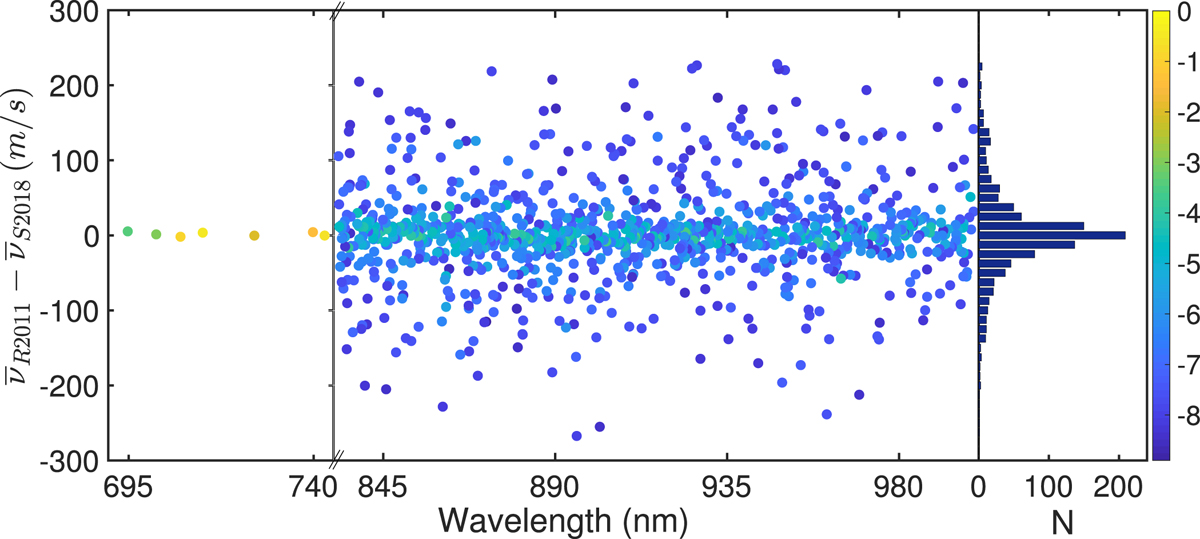
Fig. 12.

Left panel: line position difference in velocity units of the isolated confirmed U lines (i.e. with a corresponding match in the literature). The colour scale located at the right edge of the plot denotes the normalized line intensity in a logarithmic scale. From 690 to 744 nm, we can see the residuals of the eight standard lines used to calculate the k̄VIS. The x-axis is shortened for readability reasons at 744 nm. Right panel: distribution of the residuals. The distribution is centred on −0.12 ± 8.19 m s−1, where the uncertainty is calculated as the weighted standard deviation plus the statistical error introduced by the standard lines used for calibration.
Current usage metrics show cumulative count of Article Views (full-text article views including HTML views, PDF and ePub downloads, according to the available data) and Abstracts Views on Vision4Press platform.
Data correspond to usage on the plateform after 2015. The current usage metrics is available 48-96 hours after online publication and is updated daily on week days.
Initial download of the metrics may take a while.


