Fig. 10.
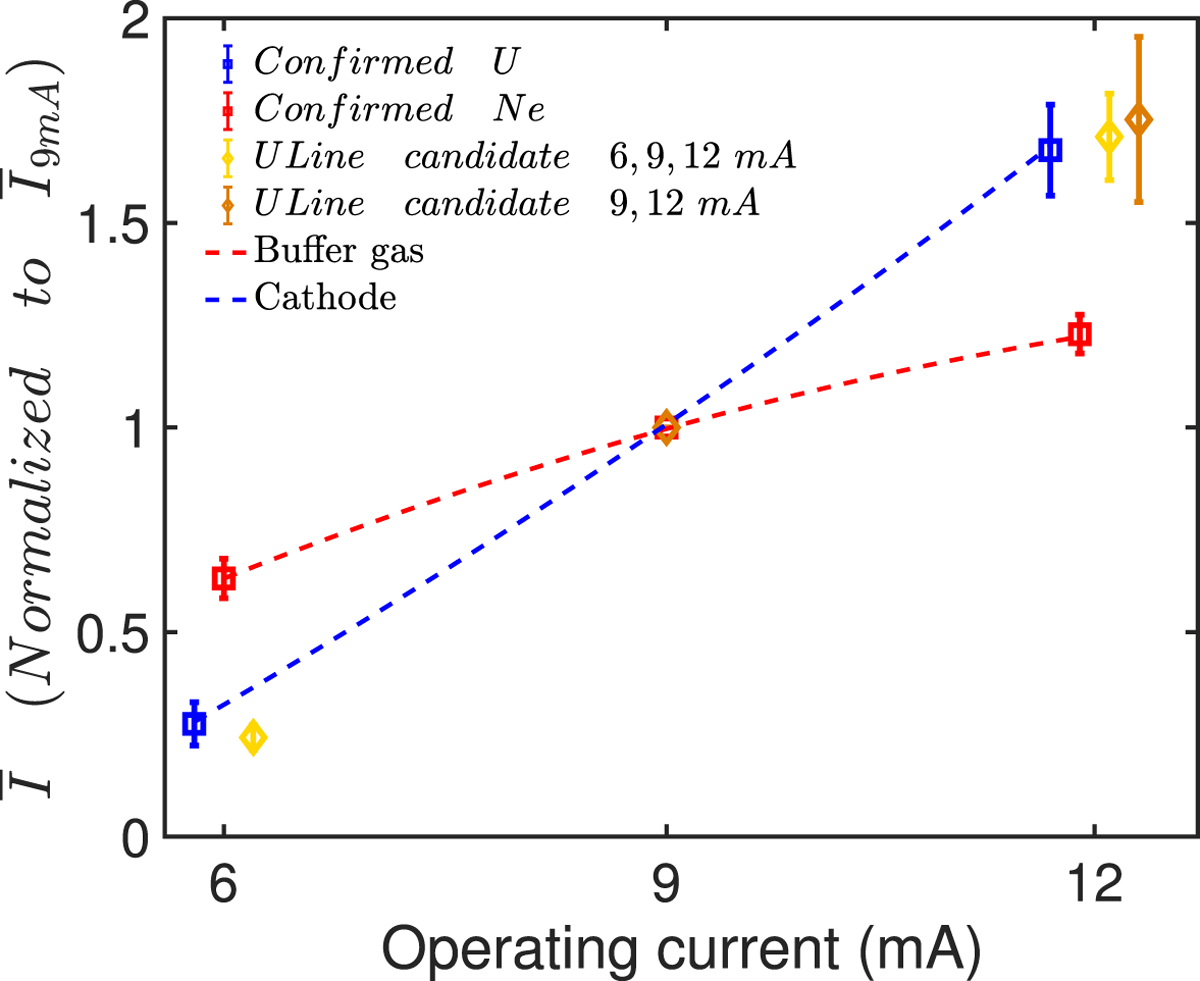
Weighted average of the line intensity normalized to the line intensity of the line in the 9 mA spectrum of the four data subsets: 258 confirmed U lines (blue squares) and 194 confirmed Ne lines (red squares), 525 U lines candidates with a match in the 6, 9, and 12 mA spectra (light brown diamonds), and 1533 U line candidates identified only in the 9 and 12 mA spectra (brown diamonds). The error bars indicate the weighted standard deviation. The red and blue dashed lines indicate the approximate trend that follows the normalized averaged intensity of the buffer gas and the cathode lines, respectively.
Current usage metrics show cumulative count of Article Views (full-text article views including HTML views, PDF and ePub downloads, according to the available data) and Abstracts Views on Vision4Press platform.
Data correspond to usage on the plateform after 2015. The current usage metrics is available 48-96 hours after online publication and is updated daily on week days.
Initial download of the metrics may take a while.