Fig. 7
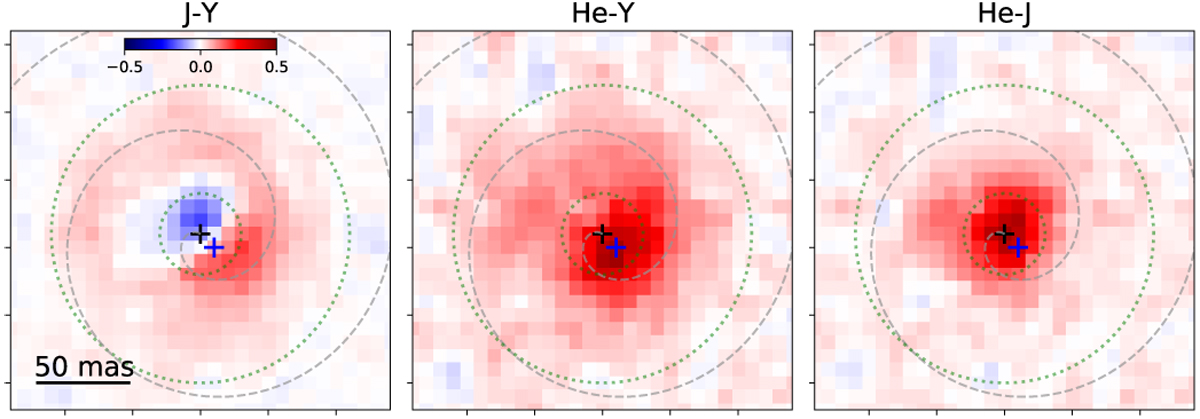
Different colour images using Y,HeI, and J bands (blue, green, and purple parts of Fig. 6). The photocentres of the Y (black cross) and J bands (blue cross) are represented as well as the best fit of the spiral, shown by a grey dashed line. The dashed green circles both represent regions from which the two spectra have been extracted in Fig. 6: from the star (inner region) and the pinwheel (between the two circles).
Current usage metrics show cumulative count of Article Views (full-text article views including HTML views, PDF and ePub downloads, according to the available data) and Abstracts Views on Vision4Press platform.
Data correspond to usage on the plateform after 2015. The current usage metrics is available 48-96 hours after online publication and is updated daily on week days.
Initial download of the metrics may take a while.