Fig. 2
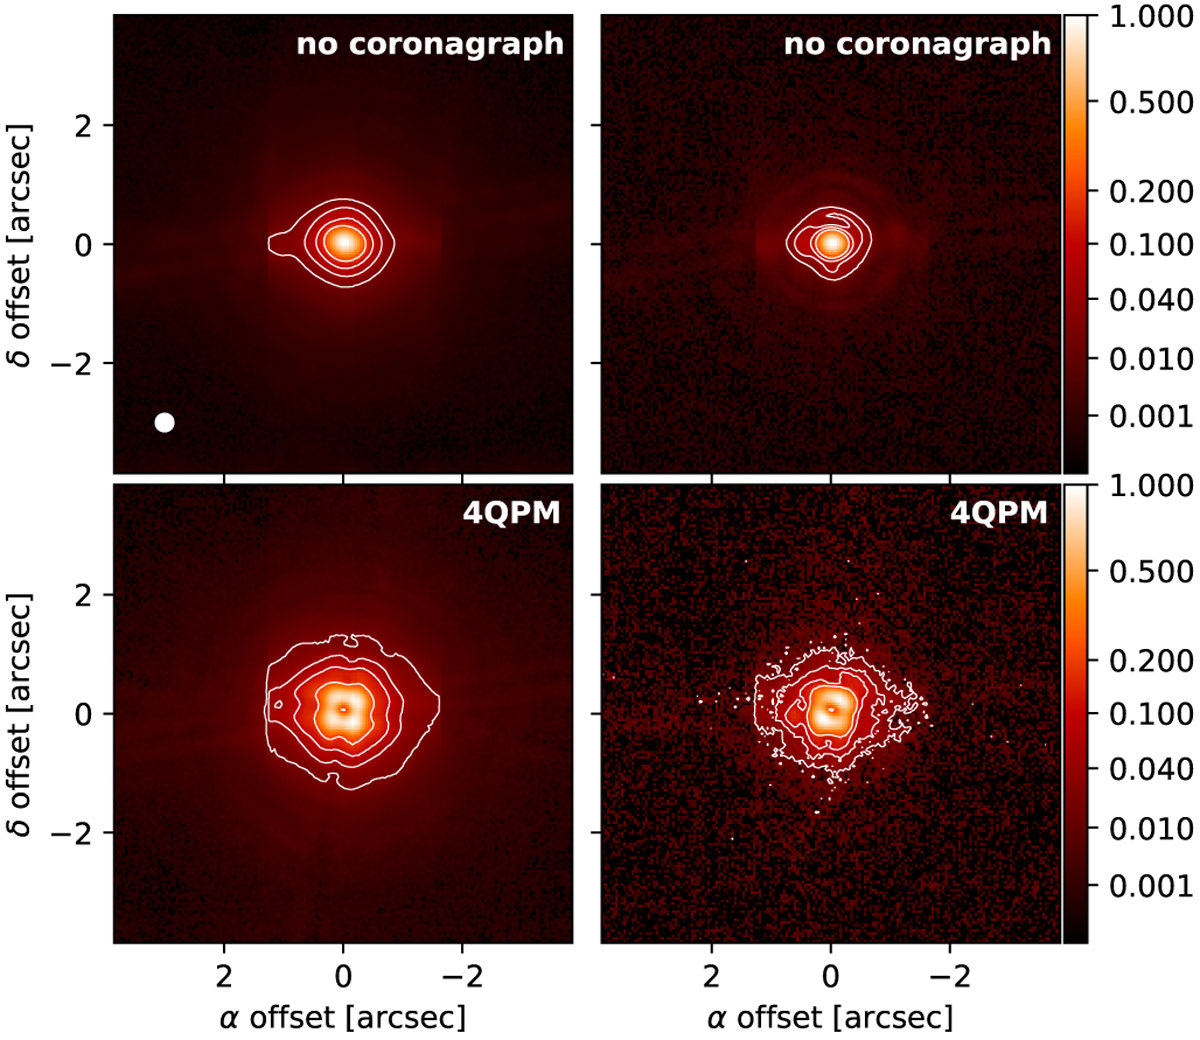
QPM coronagraph at 10.5 μm. Left panels: WR104, right panels: PSF reference star HD169916. Top panels: classical imaging. Bottom panels: coronograph mode. All images are displayed with a power normalization scale of 0.3. Contours at 2, 5, 10, and 20% of the maximum are represented. The theoretical resolution limit by the Rayleigh criterion of 1.22λ∕Dis also shown as a white circle in the upper left panel.
Current usage metrics show cumulative count of Article Views (full-text article views including HTML views, PDF and ePub downloads, according to the available data) and Abstracts Views on Vision4Press platform.
Data correspond to usage on the plateform after 2015. The current usage metrics is available 48-96 hours after online publication and is updated daily on week days.
Initial download of the metrics may take a while.