Fig. C.2
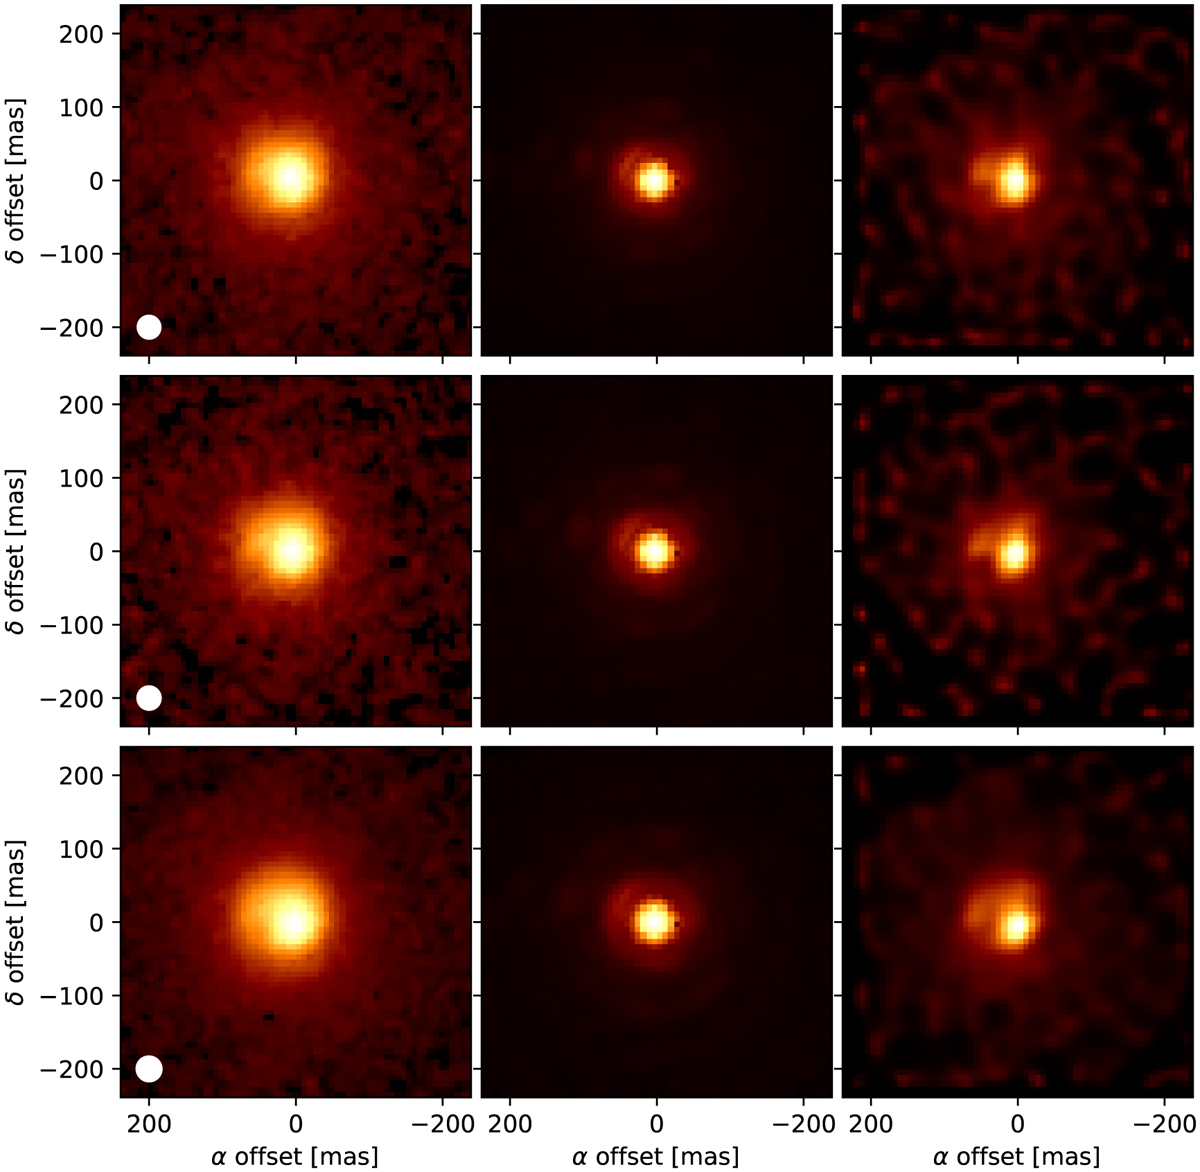
IFS images in the different parts of the spectra (see Fig. 6). Top panels: blue part of Fig. 6 (Y band, λ = 1.01 ± 0.05 μm). Middle panels: green part of Fig. 6 (He line, λ = 1.09 ± 0.03 μm). Bottom panels: purple part of Fig. 6 (J band, λ = 1.20 ± 0.07 μm). We represent the reduced image (left), the PSF calibrator (middle), and the deconvolution (right). The FWHM of the PSF is also represented by a white circle in all the panels of the left column.
Current usage metrics show cumulative count of Article Views (full-text article views including HTML views, PDF and ePub downloads, according to the available data) and Abstracts Views on Vision4Press platform.
Data correspond to usage on the plateform after 2015. The current usage metrics is available 48-96 hours after online publication and is updated daily on week days.
Initial download of the metrics may take a while.