Open Access
Fig. 13
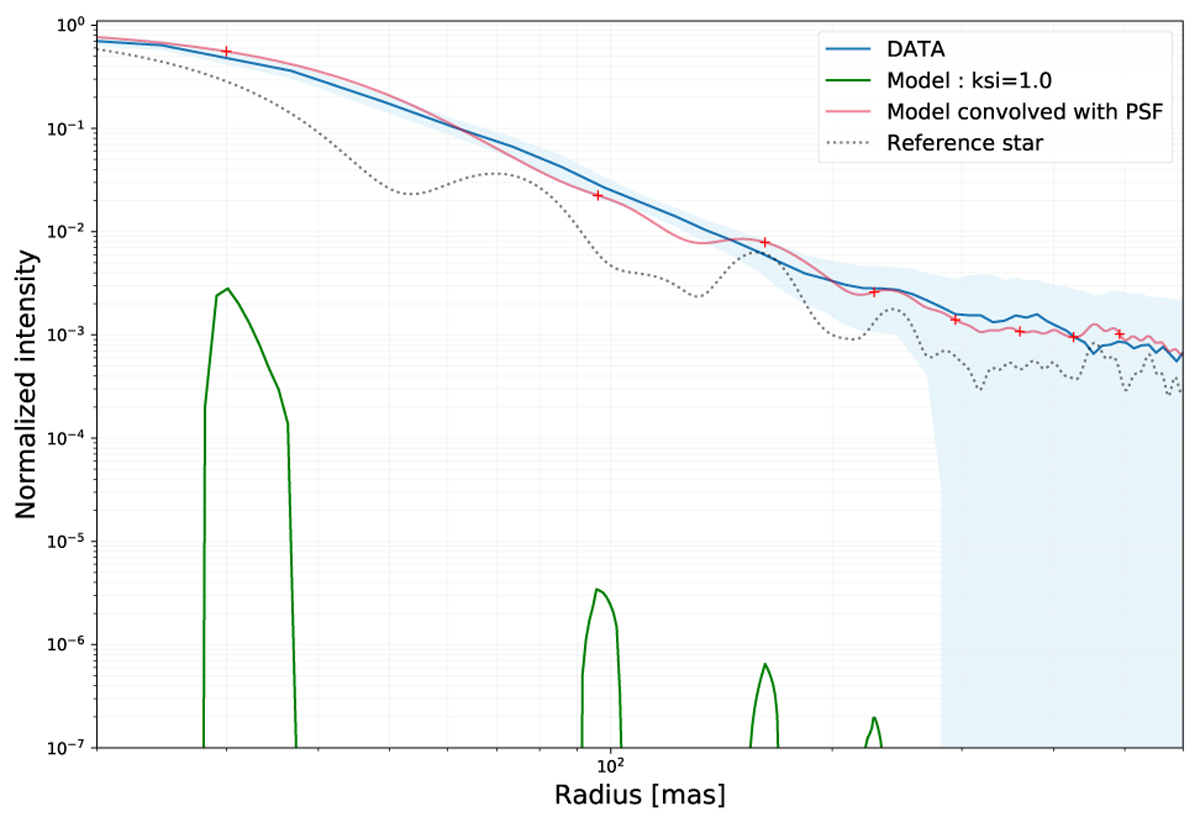
Comparison between the best model (Model 1; ξ = 1%) and the H-band data. We represent the radial profile for the model (green), reference star (dashed grey), model convolved with the PSF reference star (red), and the data (blue). The comparison points are represented with red crosses.
Current usage metrics show cumulative count of Article Views (full-text article views including HTML views, PDF and ePub downloads, according to the available data) and Abstracts Views on Vision4Press platform.
Data correspond to usage on the plateform after 2015. The current usage metrics is available 48-96 hours after online publication and is updated daily on week days.
Initial download of the metrics may take a while.