Fig. 3.
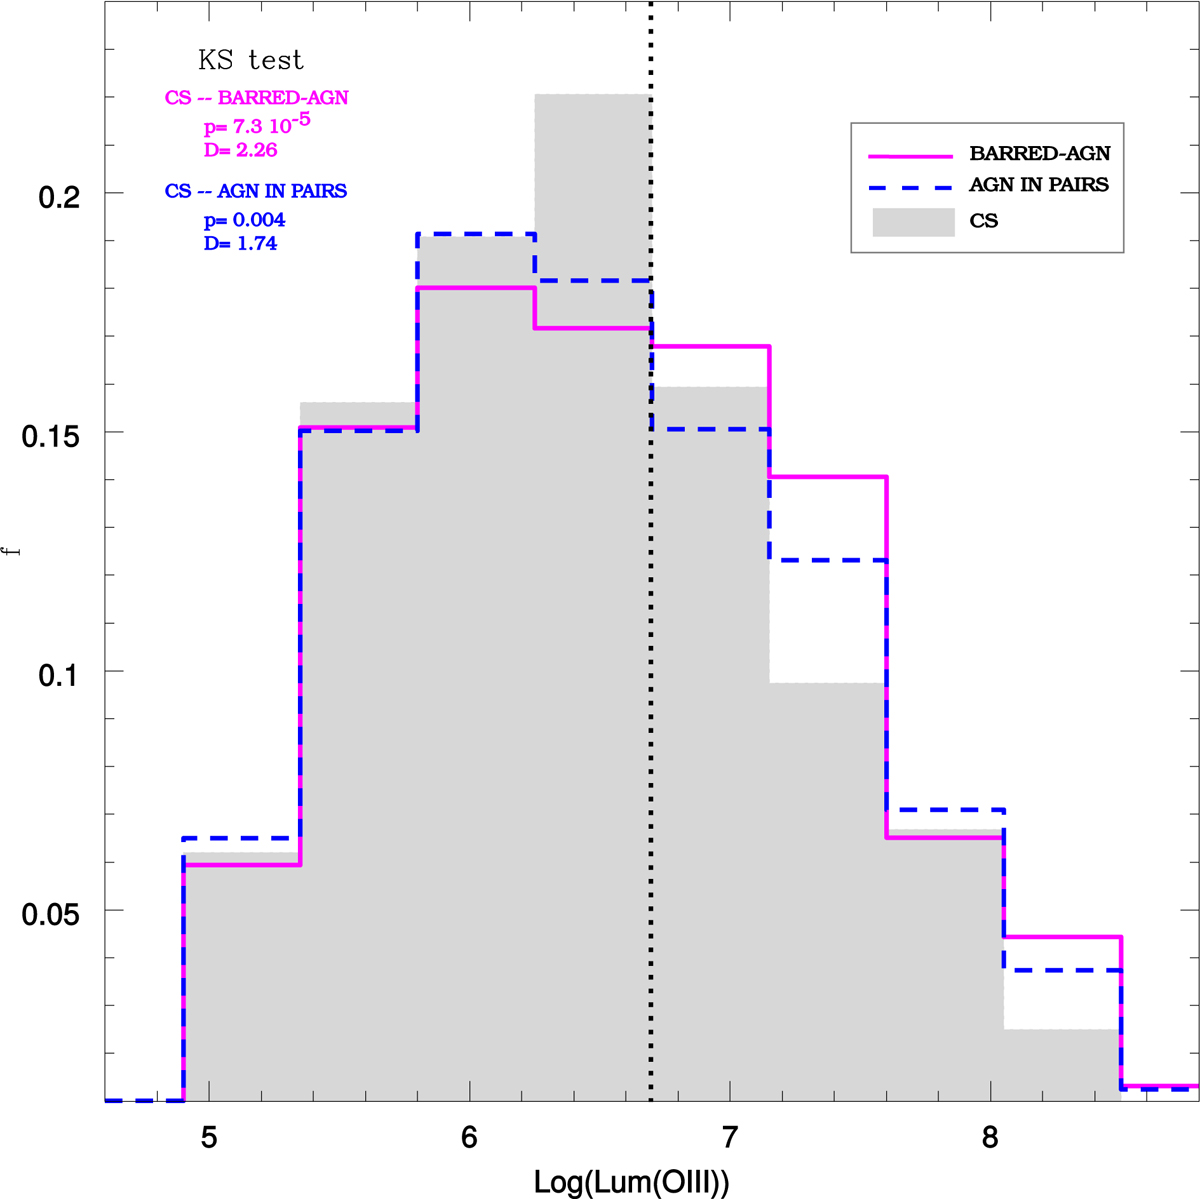
Distribution of log(Lum[OIII]) for barred AGN galaxies (solid line), AGNs in pair systems (dashed line) and unbarred AGNs in the control sample (full surfaces). The D and p-values of the KS test between both samples (barred-agn, agn in pairs) and the CS is inset in the upper-left corner of the figure. The dotted vertical line represents the excess of Lum[OIII] for the barred-agn.
Current usage metrics show cumulative count of Article Views (full-text article views including HTML views, PDF and ePub downloads, according to the available data) and Abstracts Views on Vision4Press platform.
Data correspond to usage on the plateform after 2015. The current usage metrics is available 48-96 hours after online publication and is updated daily on week days.
Initial download of the metrics may take a while.