Fig. 2.
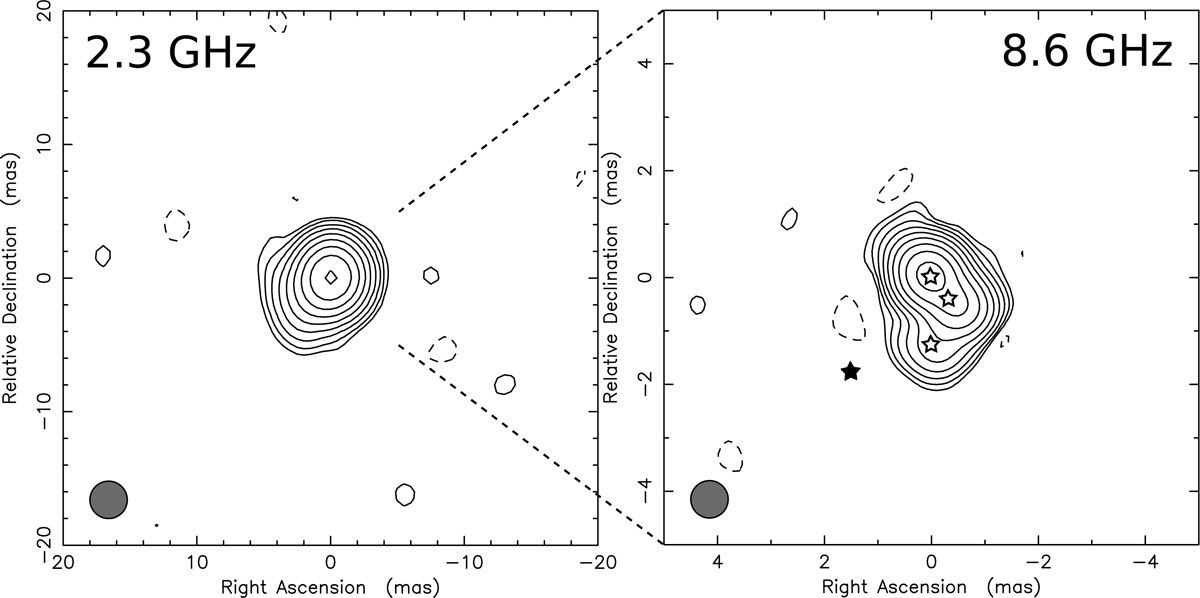
Naturally weighted VLBI images of J0906+6930. Left: at 2.3 GHz. The peak brightness is 95.6 mJy beam−1. The lowest contours are at ±0.35 mJy beam−1 (∼3σ), the positive contour levels drawn with solid lines increase by a factor of 2. The image is restored with a circular Gaussian beam of 2.8 mas (FWHM) as indicated in the lower left corner. Right: at 8.6 GHz. The peak brightness is 70.9 mJy beam−1. The lowest contours are at ±0.2 mJy beam−1 (∼3σ), the positive contour levels increase by a factor of 2. The image is restored with a circular Gaussian beam of 0.7 mas (FWHM). Open star symbols indicate the locations of fitted Gaussian brightness distribution model components at 8.6 GHz. The filled symbol shows the position of the jet component fitted to the 2.3 GHz data (see Table 2).
Current usage metrics show cumulative count of Article Views (full-text article views including HTML views, PDF and ePub downloads, according to the available data) and Abstracts Views on Vision4Press platform.
Data correspond to usage on the plateform after 2015. The current usage metrics is available 48-96 hours after online publication and is updated daily on week days.
Initial download of the metrics may take a while.