Free Access
Fig. 2.
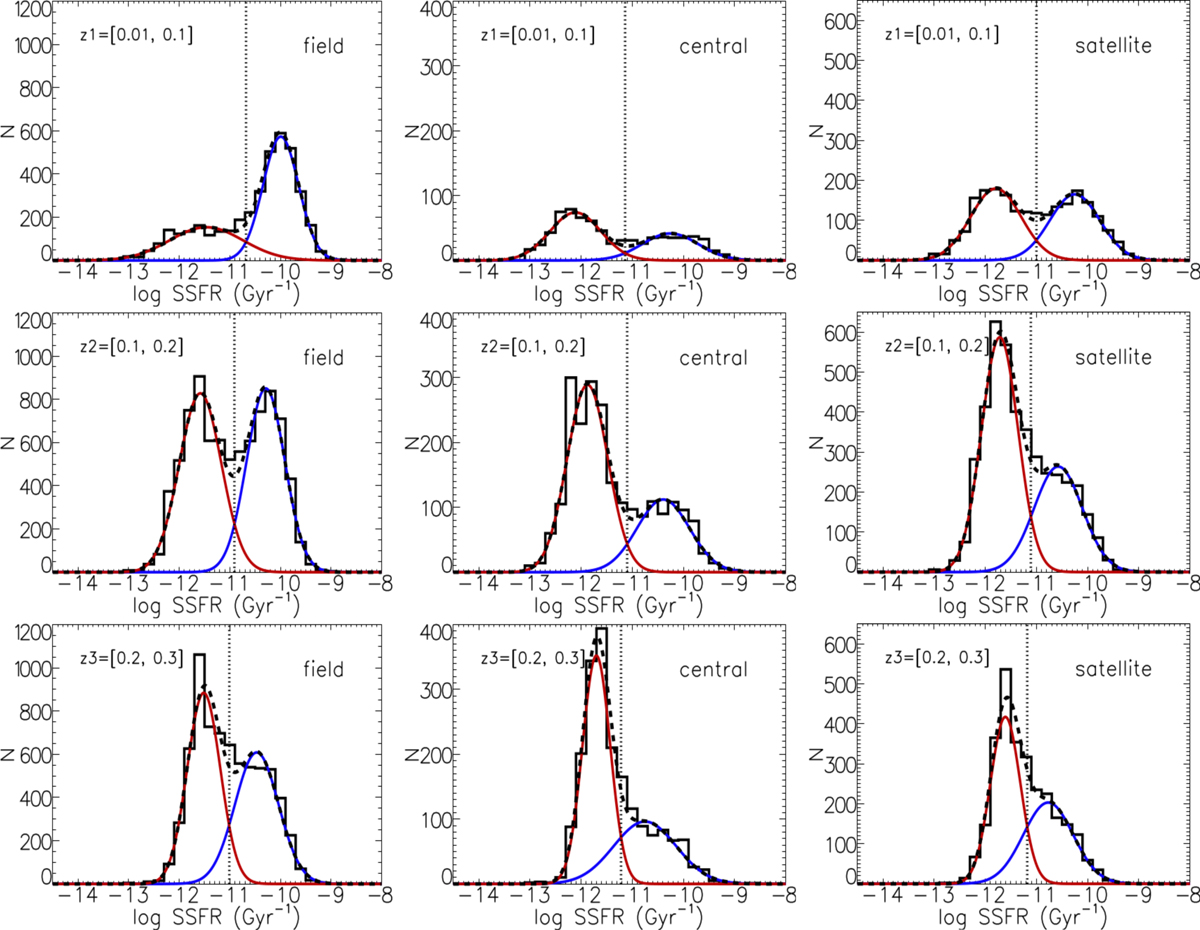
log SSFR distribution for field, central and satellite galaxies, which can be fit by the combination of two Gaussians (the blue line and the red line). The dashed line is the sum of the two. The dotted line indicates where the blue line is equal to the red line in amplitude.
Current usage metrics show cumulative count of Article Views (full-text article views including HTML views, PDF and ePub downloads, according to the available data) and Abstracts Views on Vision4Press platform.
Data correspond to usage on the plateform after 2015. The current usage metrics is available 48-96 hours after online publication and is updated daily on week days.
Initial download of the metrics may take a while.