Fig. 6.
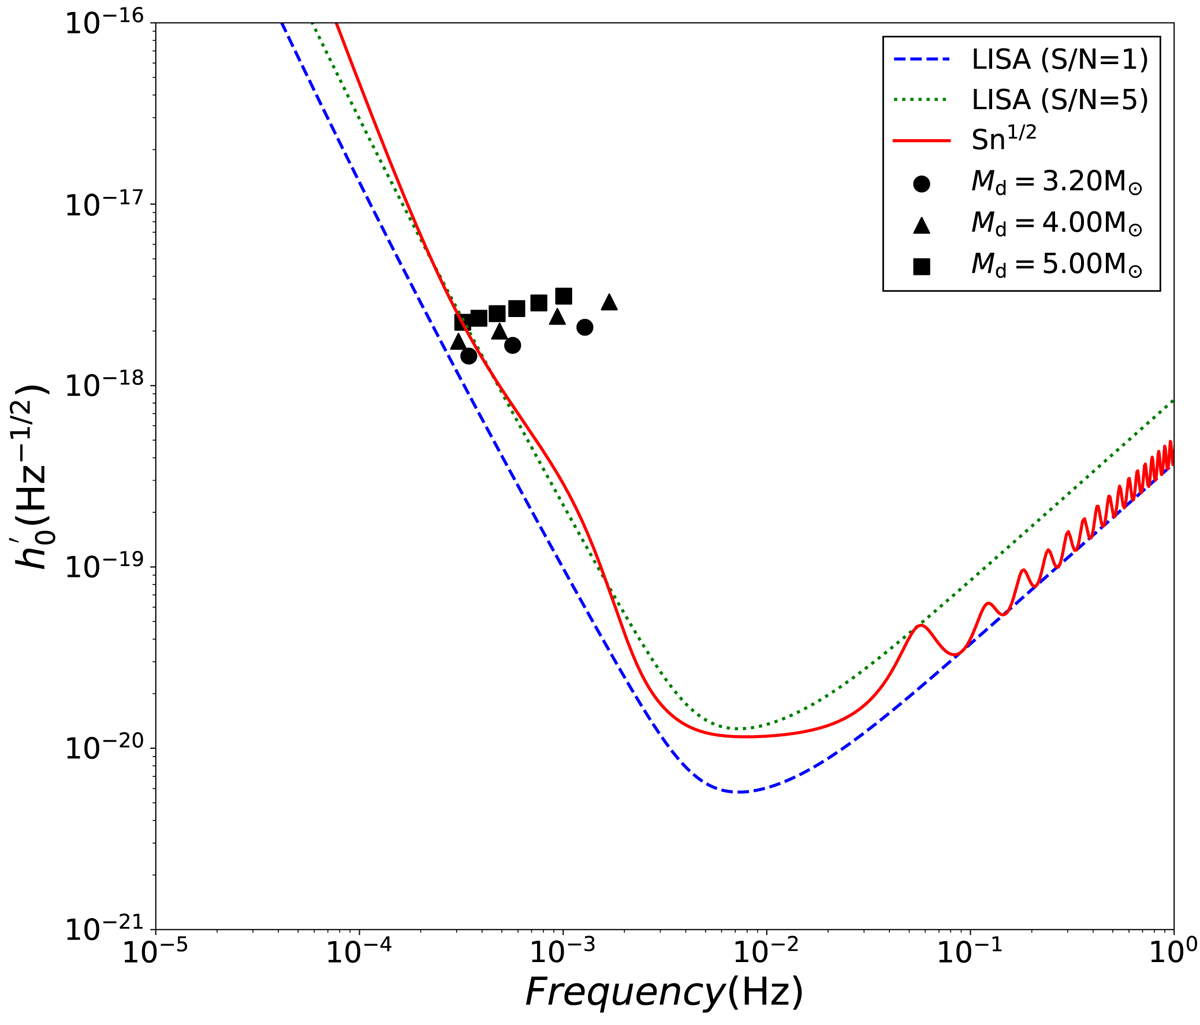
Root spectral density of GW strain as a function of GW frequency. Black symbols represent the GW signal of sdB+NS systems from the CE ejection channel, where ~D = 10 kpc, T = 4 yr are assumed. The dashed and dotted lines plot the sensitivity curves of LISA with an S/N = 1 and S/N = 5, respectively (Klein et al. 2016), and the solid line shows the full sensitivity curve combining the instrument noise and Galactic confusion noise (Cornish & Robson 2018).
Current usage metrics show cumulative count of Article Views (full-text article views including HTML views, PDF and ePub downloads, according to the available data) and Abstracts Views on Vision4Press platform.
Data correspond to usage on the plateform after 2015. The current usage metrics is available 48-96 hours after online publication and is updated daily on week days.
Initial download of the metrics may take a while.