Free Access
Fig. 5.
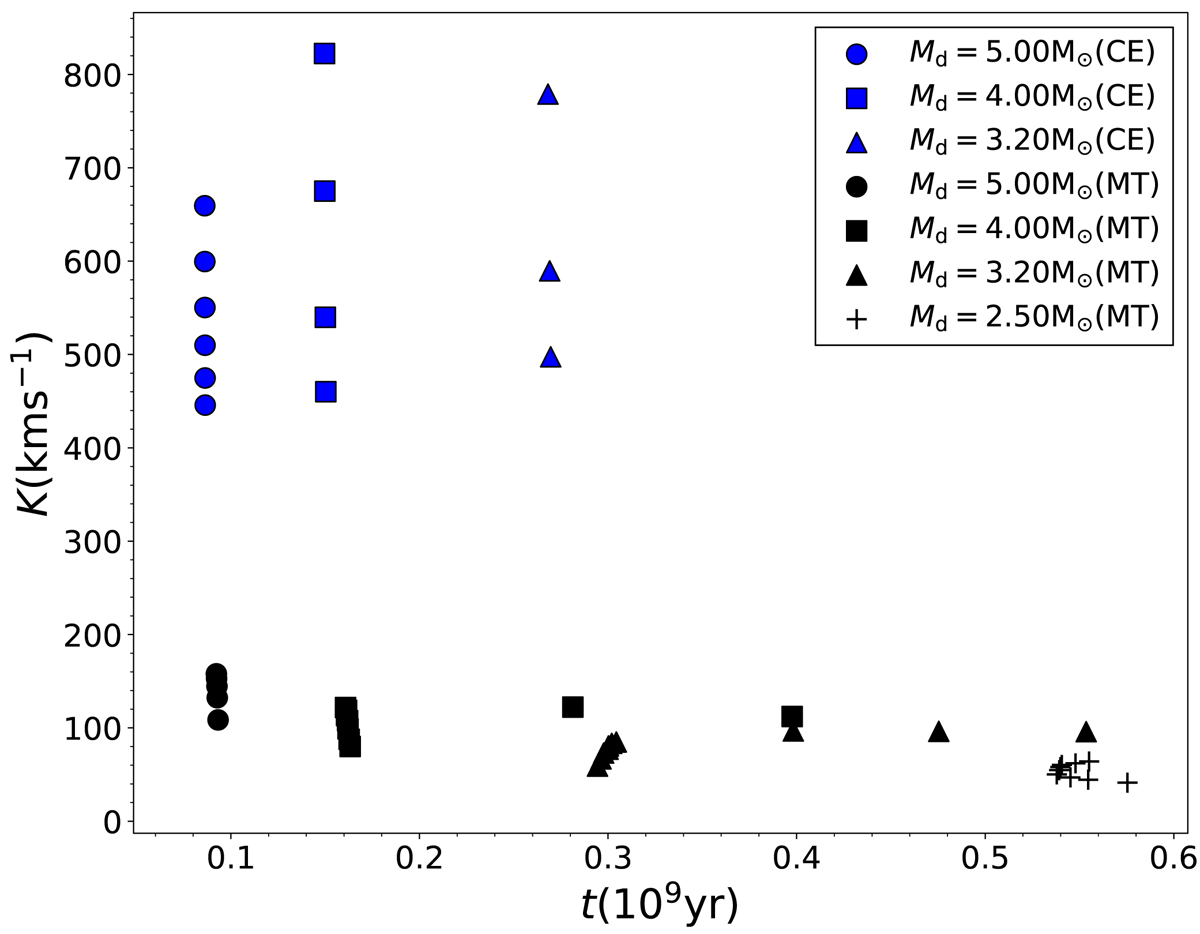
Formation age of sdB+NS binaries vs. RV semi-amplitude. The blue symbols show binaries from the CE ejection channel, and the black symbols represent binaries from stable RLOF. Different shapes show different initial donor masses as indicated in the plot.
Current usage metrics show cumulative count of Article Views (full-text article views including HTML views, PDF and ePub downloads, according to the available data) and Abstracts Views on Vision4Press platform.
Data correspond to usage on the plateform after 2015. The current usage metrics is available 48-96 hours after online publication and is updated daily on week days.
Initial download of the metrics may take a while.