Fig. 3.
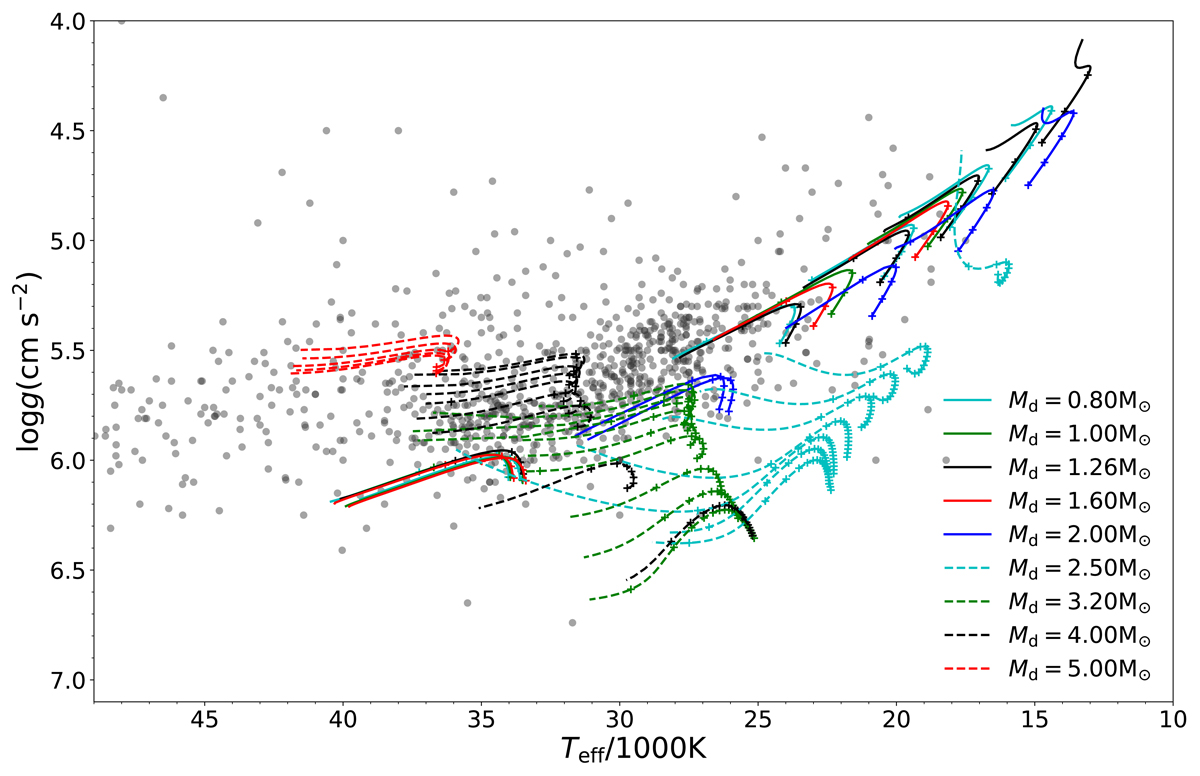
Effective temperature-gravity diagram for sdBs produced in our study. For clarity, only the He-core burning phase is presented here. The solid lines show those from degenerate He cores before its ignition (![]() ), and the dashed lines show those from non-degenerate He cores (
), and the dashed lines show those from non-degenerate He cores (![]() ). Different colors represent different donor masses as indicated in the figure. The age differences between adjacent crosses are 2.5 × 10⁷ yr for each evolutionary track. The dots show known hot subdwarfs (Geier et al. 2017b).
). Different colors represent different donor masses as indicated in the figure. The age differences between adjacent crosses are 2.5 × 10⁷ yr for each evolutionary track. The dots show known hot subdwarfs (Geier et al. 2017b).
Current usage metrics show cumulative count of Article Views (full-text article views including HTML views, PDF and ePub downloads, according to the available data) and Abstracts Views on Vision4Press platform.
Data correspond to usage on the plateform after 2015. The current usage metrics is available 48-96 hours after online publication and is updated daily on week days.
Initial download of the metrics may take a while.