Fig. 2.
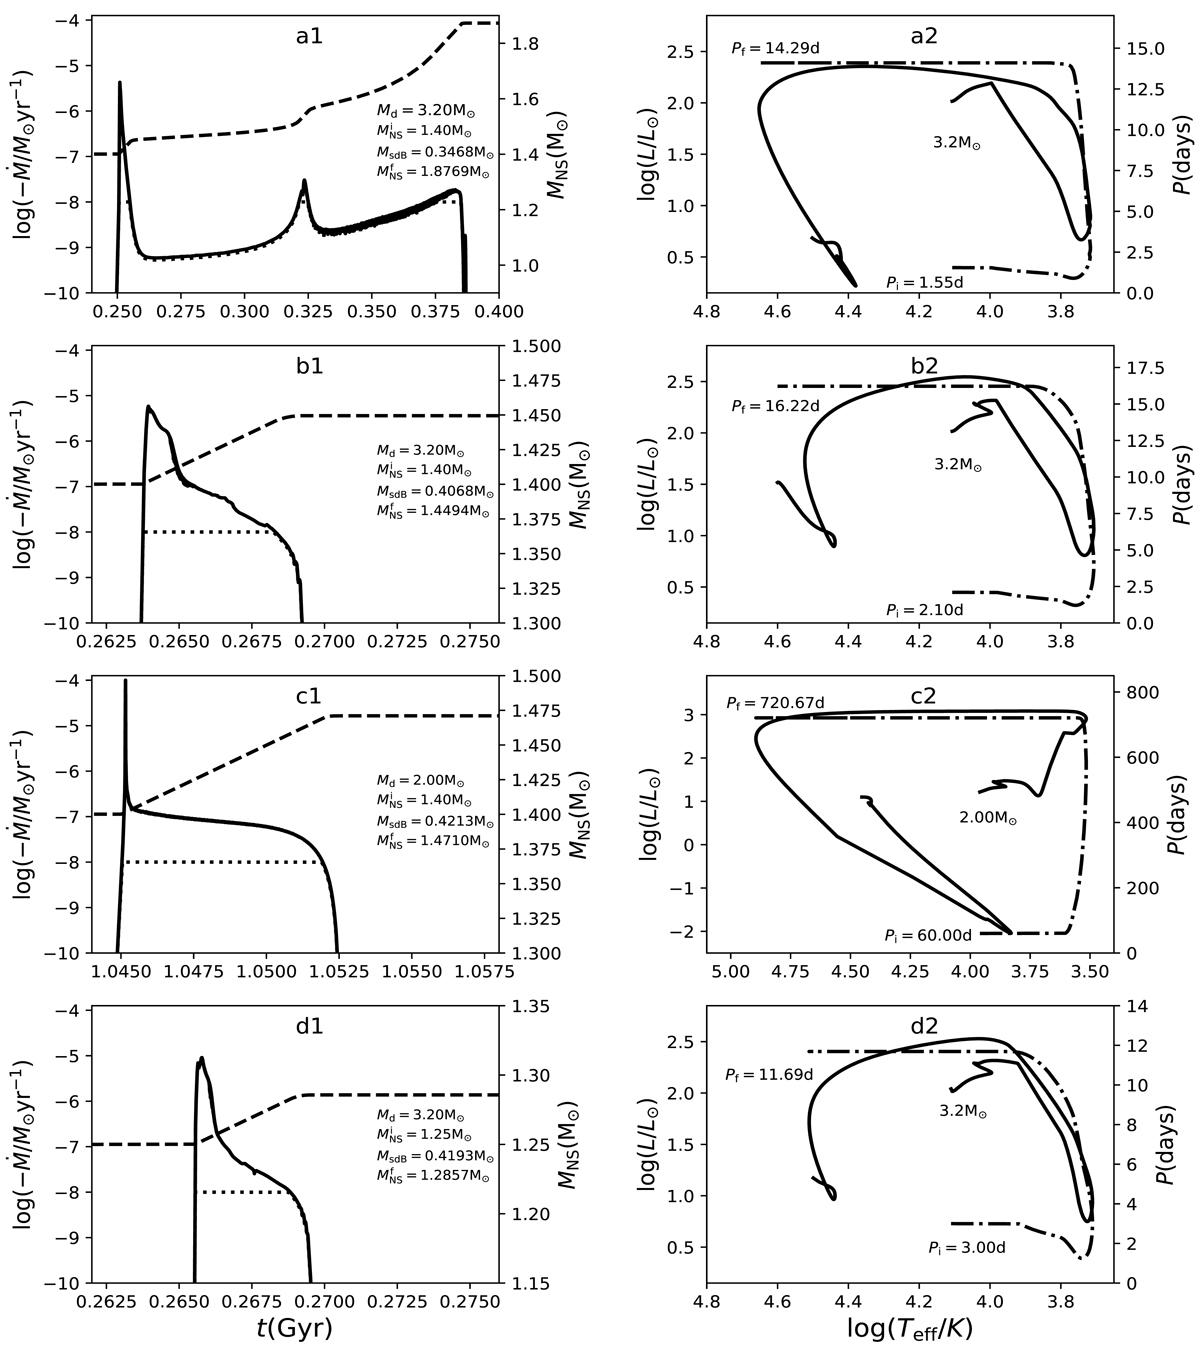
Details of the evolution for four representative cases in our study. Panels a to c show the models in which the donor starts mass transfer at different evolutionary phases, i.e., on the MS, during the HG, and on the GB, respectively, with an NS mass of 1.4 M⊙, and panel d shows an alternative to the NS mass, i.e., ![]() . For each of the models, the mass-transfer rate (solid line), the mass-accretion rate of the NS (dotted line), and the mass of the NS (dashed line) are shown in the left panels, and the corresponding evolutionary track (solid line) and orbital period change (dot-dashed line) are presented in the right panels. The initial and final component masses are indicated in the left panels, and the initial and final orbital periods , Pi and Pf, are indicated in the right panels.
. For each of the models, the mass-transfer rate (solid line), the mass-accretion rate of the NS (dotted line), and the mass of the NS (dashed line) are shown in the left panels, and the corresponding evolutionary track (solid line) and orbital period change (dot-dashed line) are presented in the right panels. The initial and final component masses are indicated in the left panels, and the initial and final orbital periods , Pi and Pf, are indicated in the right panels.
Current usage metrics show cumulative count of Article Views (full-text article views including HTML views, PDF and ePub downloads, according to the available data) and Abstracts Views on Vision4Press platform.
Data correspond to usage on the plateform after 2015. The current usage metrics is available 48-96 hours after online publication and is updated daily on week days.
Initial download of the metrics may take a while.