Fig. 1.
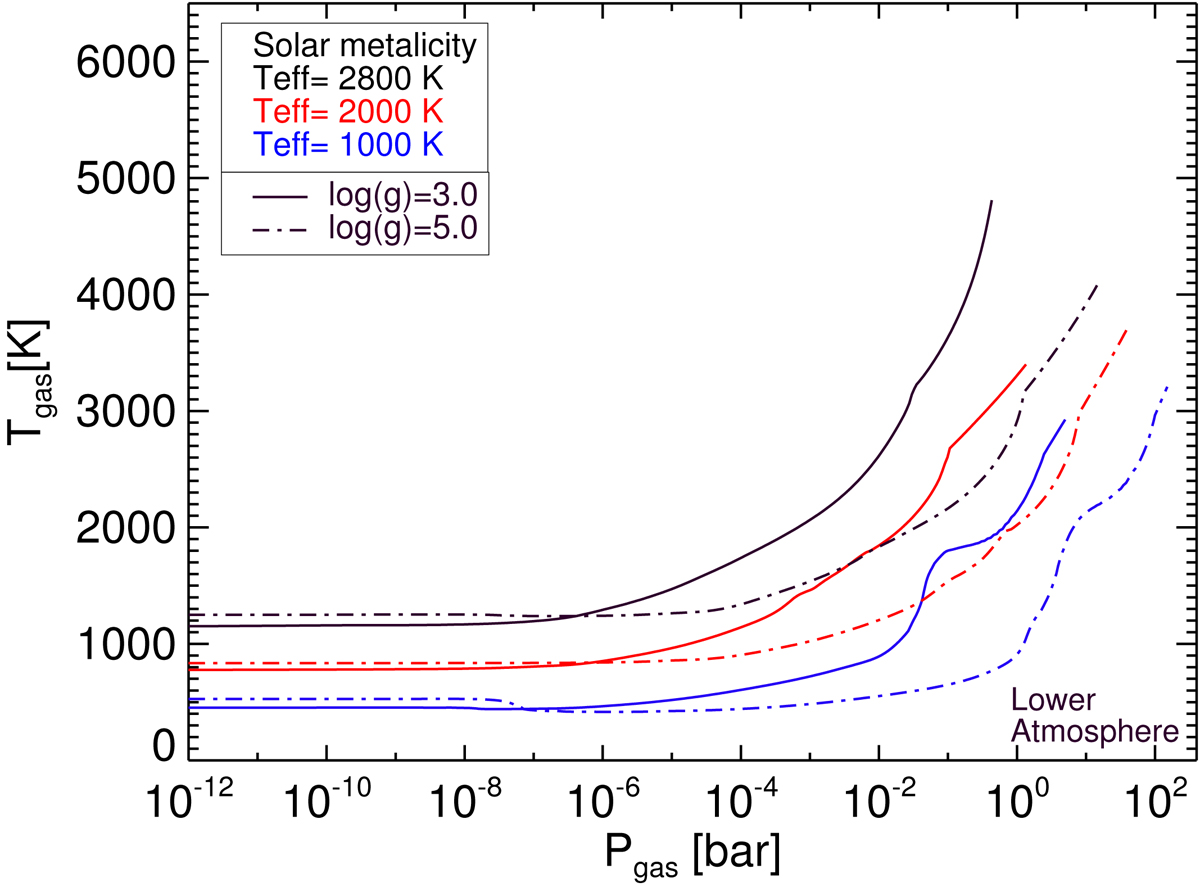
(T gas–p gas) profile from the DRIFT-PHOENIX model atmosphere simulations. (The (p gas–z) correlation can be found in Fig. A.1.) These models are used as input for the Monte Carlo photoionisation calculation. The hottest atmosphere represents a late-M dwarf or young brown dwarf atmosphere. The coolest atmosphere represents a planetary regime atmosphere.
Current usage metrics show cumulative count of Article Views (full-text article views including HTML views, PDF and ePub downloads, according to the available data) and Abstracts Views on Vision4Press platform.
Data correspond to usage on the plateform after 2015. The current usage metrics is available 48-96 hours after online publication and is updated daily on week days.
Initial download of the metrics may take a while.