Fig. 7
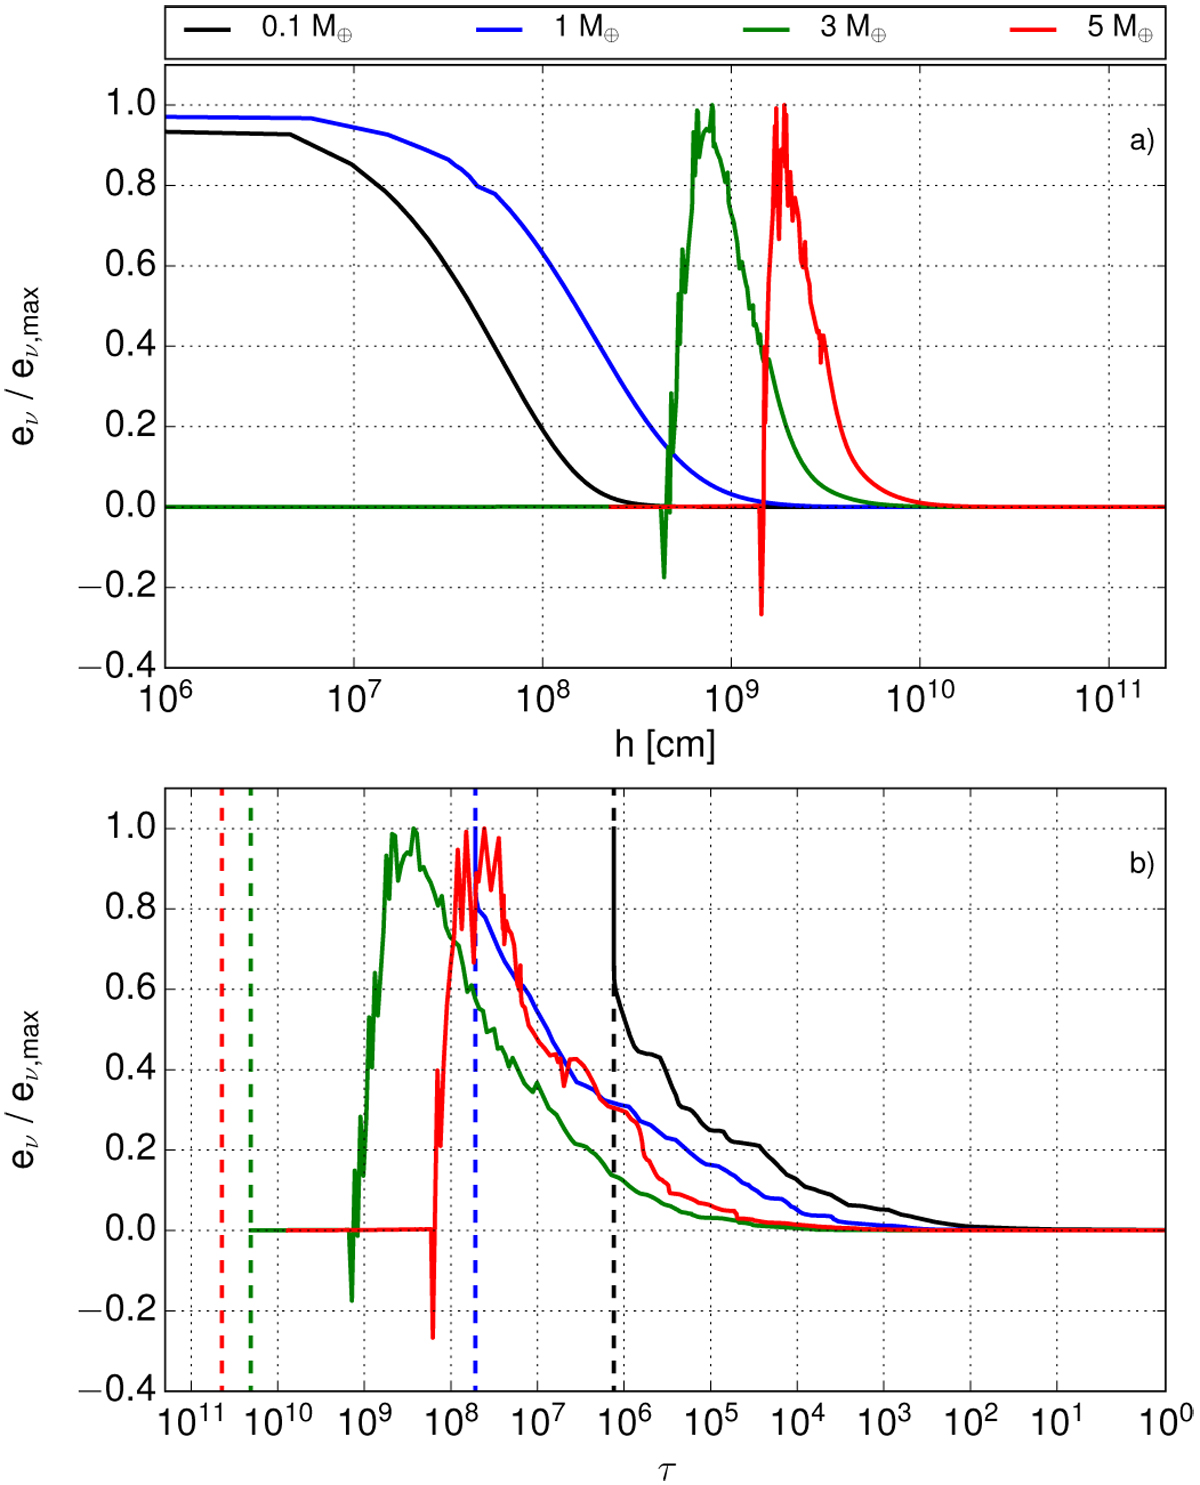
Panel a: relative heating capacity eν in values of eν,max as a functionof altitude for 4 different core masses MC = 0.1 M⊕ (black), 1 M⊕ (blue), 3 M⊕ (green), and 5 M⊕ (red). Here, eν is the heating/cooling rate of the atmosphere evaluated with 701 mass bins, folded with the size distribution function ν and weighted with the planet’s mass accretion rate ![]() MC [M⊕ yr −1]. Whereas forsmaller planets planetesimals cause a general heating of the atmosphere, for larger cores local cooling can occur (compare MC = 3 and MC = 5 M⊕). Panel b: eν in values of eν,tot as a functionof optical depth τ. Again we compare 4 different core masses with MC = 0.1 M⊕ (black), 1 M⊕ (blue), 3 M⊕ (green), and 5 M⊕ (red). The dashed lines represent the individual protoplanetary surfaces. Planetesimal infall results in a maximum energy input/output within the optical thick layers of the atmosphere.
MC [M⊕ yr −1]. Whereas forsmaller planets planetesimals cause a general heating of the atmosphere, for larger cores local cooling can occur (compare MC = 3 and MC = 5 M⊕). Panel b: eν in values of eν,tot as a functionof optical depth τ. Again we compare 4 different core masses with MC = 0.1 M⊕ (black), 1 M⊕ (blue), 3 M⊕ (green), and 5 M⊕ (red). The dashed lines represent the individual protoplanetary surfaces. Planetesimal infall results in a maximum energy input/output within the optical thick layers of the atmosphere.
Current usage metrics show cumulative count of Article Views (full-text article views including HTML views, PDF and ePub downloads, according to the available data) and Abstracts Views on Vision4Press platform.
Data correspond to usage on the plateform after 2015. The current usage metrics is available 48-96 hours after online publication and is updated daily on week days.
Initial download of the metrics may take a while.