Fig. 1
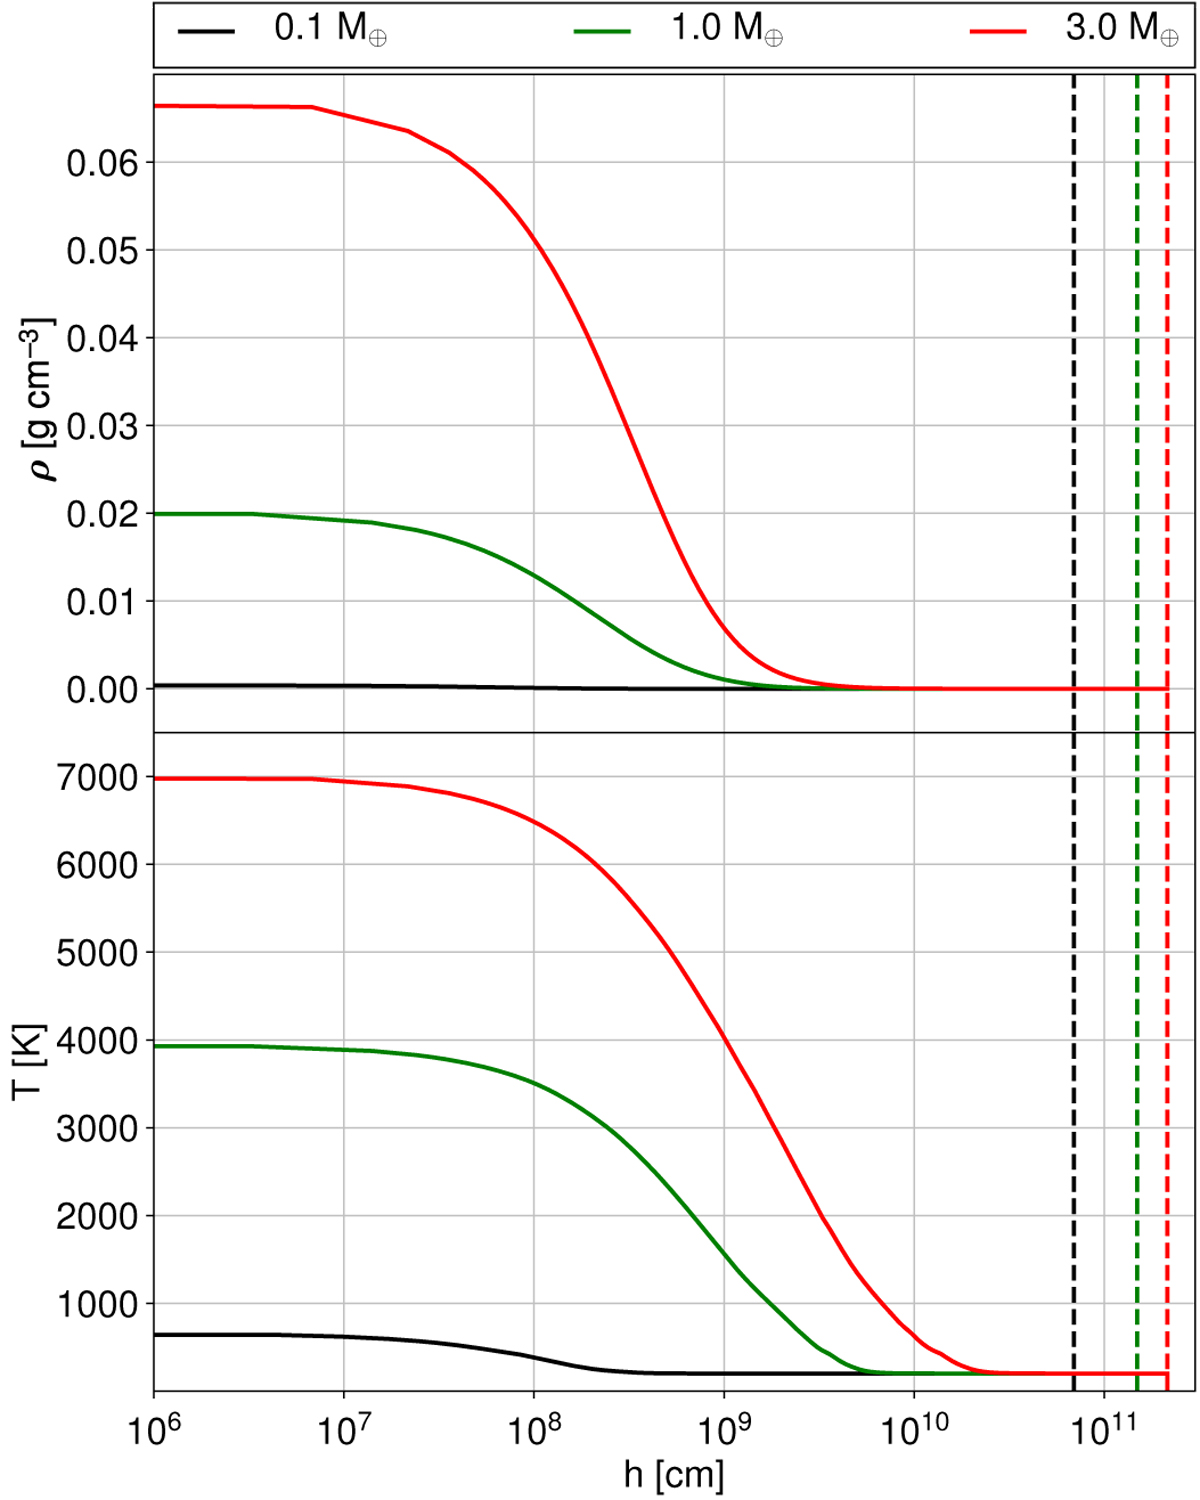
Density (upper panel) and temperature (lower panel) profiles of primordial atmospheres as a function of altitude, for core masses of 0.1 M⊕ (black), 1 M⊕ (green), and 3 M⊕ (red). The dashed lines represent the individual Hill radii of the cores. These data represent a snapshot at 1 Myr from the time-dependent atmospheric evolution simulations and a star with 1 M⊙ (see Stökl et al. 2016).
Current usage metrics show cumulative count of Article Views (full-text article views including HTML views, PDF and ePub downloads, according to the available data) and Abstracts Views on Vision4Press platform.
Data correspond to usage on the plateform after 2015. The current usage metrics is available 48-96 hours after online publication and is updated daily on week days.
Initial download of the metrics may take a while.