Fig. 9
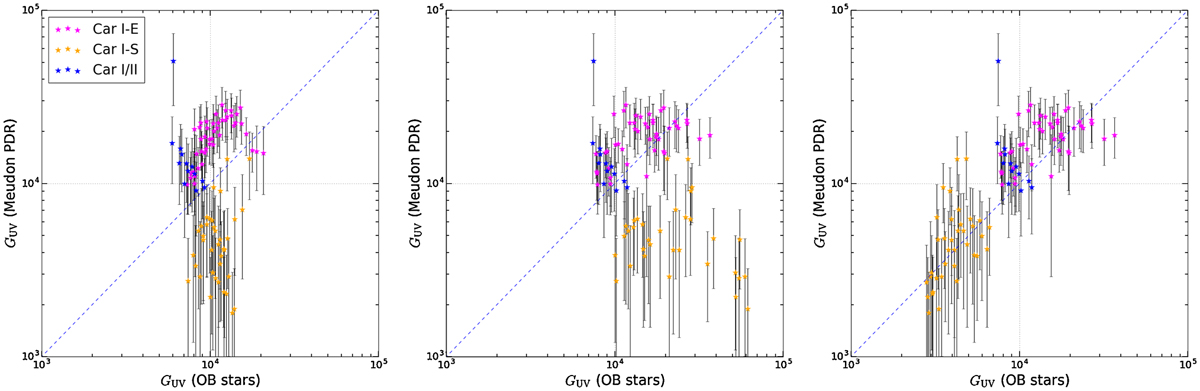
Comparison of the GUV values obtained with the Meudon PDR code and the values evaluated from the stellar composition within our FOV. Only pixels with good (S∕N > 3) detection of CO J = 7−6 are plotted. The dashed lines indicates a 1 : 1 relationship between the quantities on the axes. The uncertainties of the GUV values derived with the Meudon PDR models are estimated with the MC experiment as discussed in Sect. 3.2. Left panel: all OB-stars are assumed to be at the center of their host star-clusters, i.e., Trumpler 14 and 16. The observed CO gas is assumed to lie on the plane perpendicular to the line of sight at a 2.35 kpc distance. Center panel: distribution of OB-stars is considered coplanar at their observed (α, δ) coordinates. The geometry of the CO gas is assumed to be coplanar as in the textitleft panel. Right panel: distribution of OB-stars is considered coplanar at their observed (α, δ) coordinates. The geometry of the CO gas is assumed as the shape indicated in Fig. 11.
Current usage metrics show cumulative count of Article Views (full-text article views including HTML views, PDF and ePub downloads, according to the available data) and Abstracts Views on Vision4Press platform.
Data correspond to usage on the plateform after 2015. The current usage metrics is available 48-96 hours after online publication and is updated daily on week days.
Initial download of the metrics may take a while.