Fig. 2
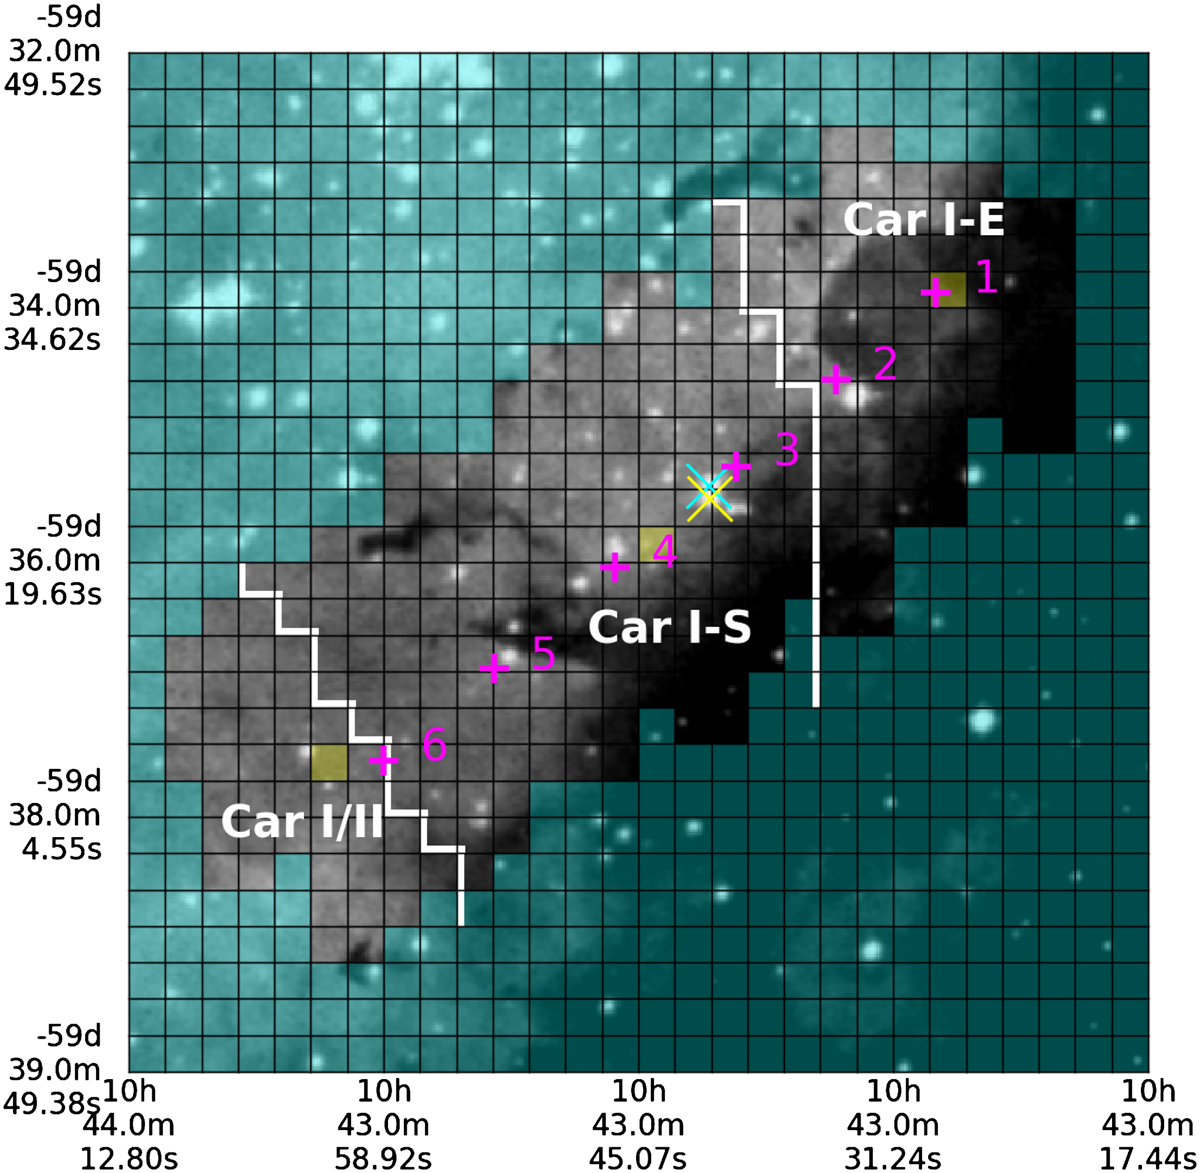
A zoom-in of our FOV (the white square in Fig. 1). The effective FOV is indicated by the pixels in gray-colors. The background image is the optical image taken in the DSS2-red band. The positions of the central bolometer, SLWC4, at the six requested pointings are indicated with the magenta crosses and labeled accordingly as in Table 1. The boundaries of Car I-E, Car I-S, and Car I/II areas are indicated with the thick white lines. The locations of two massive stars, ALS 15 204 and ALS 15 203, discussed in Sect. 4.2 are marked with the cyan and yellow “×” in the figure. The CO SLED observed from the three yellow-masked pixels are displayed in Fig. 8 and discussed in Sect. 5.1.
Current usage metrics show cumulative count of Article Views (full-text article views including HTML views, PDF and ePub downloads, according to the available data) and Abstracts Views on Vision4Press platform.
Data correspond to usage on the plateform after 2015. The current usage metrics is available 48-96 hours after online publication and is updated daily on week days.
Initial download of the metrics may take a while.