Open Access
Fig. 10
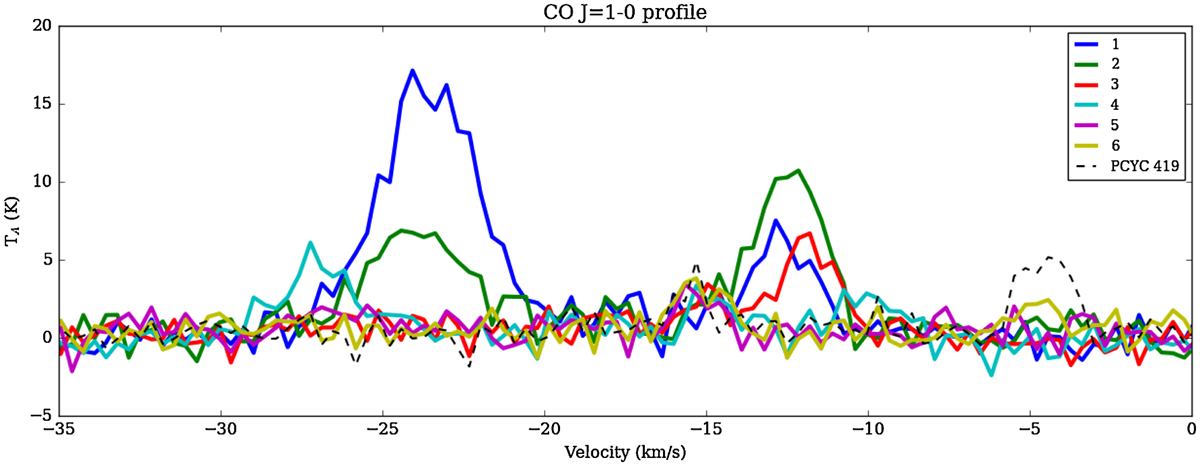
Spectrally resolved line profiles at six positions indicated in Fig. 2. The data is taken as a part of the Carina Parkes-ATCA Radio Continuum Survey (Rebolledo et al. 2016). The dashed line indicates the line profile at a ~ 0.2 pc region from Car I/II (see Sect. 5.1).
Current usage metrics show cumulative count of Article Views (full-text article views including HTML views, PDF and ePub downloads, according to the available data) and Abstracts Views on Vision4Press platform.
Data correspond to usage on the plateform after 2015. The current usage metrics is available 48-96 hours after online publication and is updated daily on week days.
Initial download of the metrics may take a while.