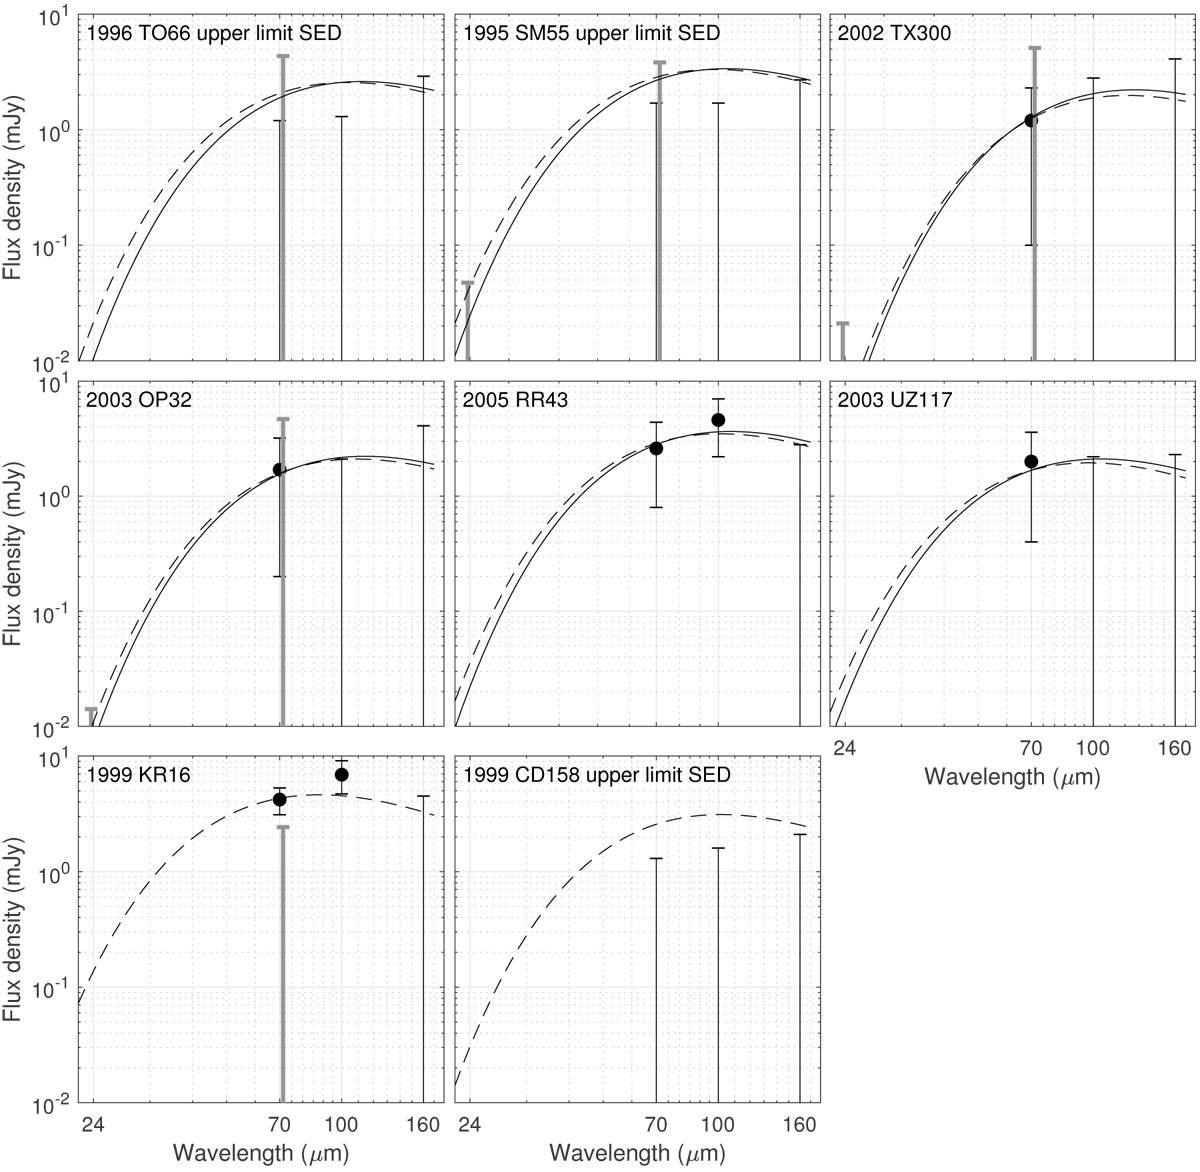
Fig. 1

Modelled flux densities as function of wavelength calculated from solutions in Table 5. Solid lines (when present) are the preferred solutions, dashed lines are fixed beaming factor solutions with η = 1.20, except for 2002 TX300, where the solid line has η = 1.8 and the dashed line η = 0.73. Black data points are PACS data (70, 100, and 160 μm) and grey points are from MIPS (23.68 and 71.42 μm) normalized to the observing geometry of PACS. Error bars are 1σ uncertainties or 1σ upper limits. Upper limit solutions have been calculated for non-detected targets using the 2σ flux density upper limit of the most limiting band (see text).
Current usage metrics show cumulative count of Article Views (full-text article views including HTML views, PDF and ePub downloads, according to the available data) and Abstracts Views on Vision4Press platform.
Data correspond to usage on the plateform after 2015. The current usage metrics is available 48-96 hours after online publication and is updated daily on week days.
Initial download of the metrics may take a while.


