Free Access
Fig. 2.
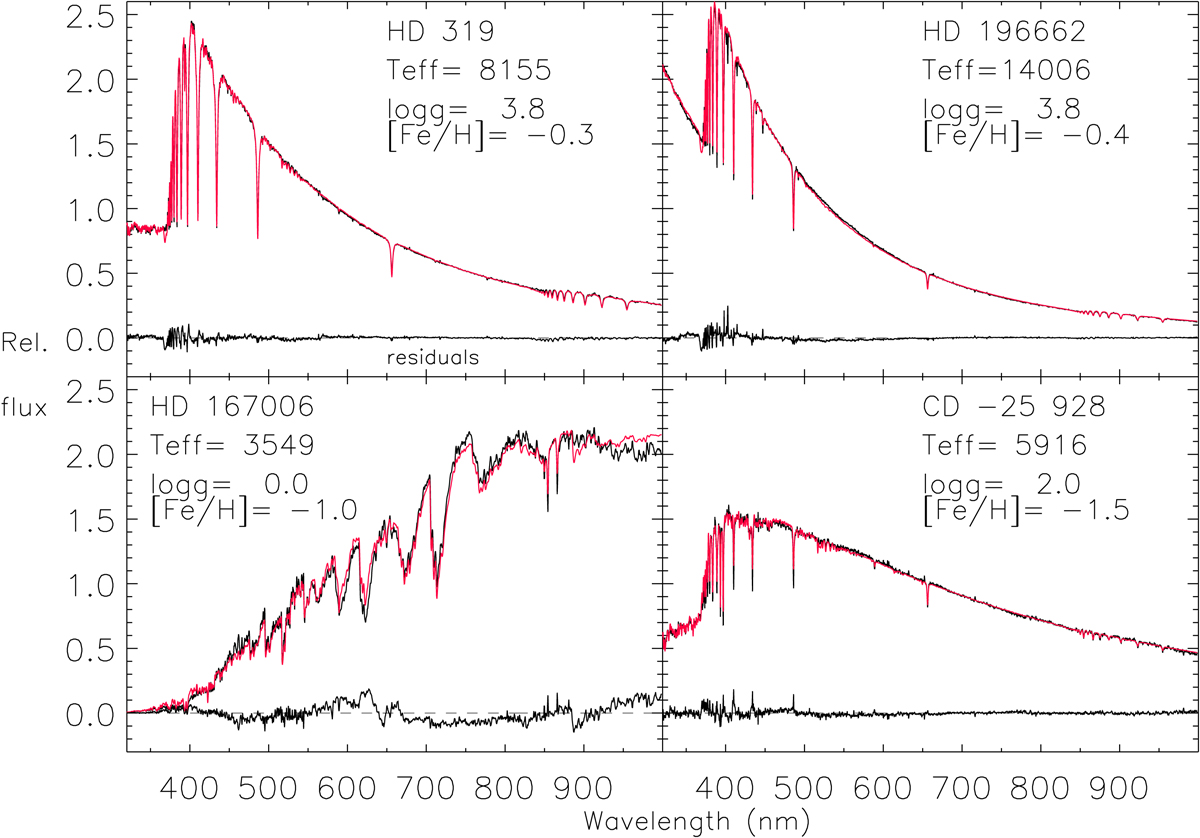
Comparison between STIS observations from NGSL (black lines) and best-fitting models (red). The residuals are also shown in black. The labels show the parameters recovered with FERRE. The vertical scale corresponds to the stellar flux (erg cm−2 s−1 Å−1) normalized by the mean value in the selected spectral range.
Current usage metrics show cumulative count of Article Views (full-text article views including HTML views, PDF and ePub downloads, according to the available data) and Abstracts Views on Vision4Press platform.
Data correspond to usage on the plateform after 2015. The current usage metrics is available 48-96 hours after online publication and is updated daily on week days.
Initial download of the metrics may take a while.