Fig. 5.
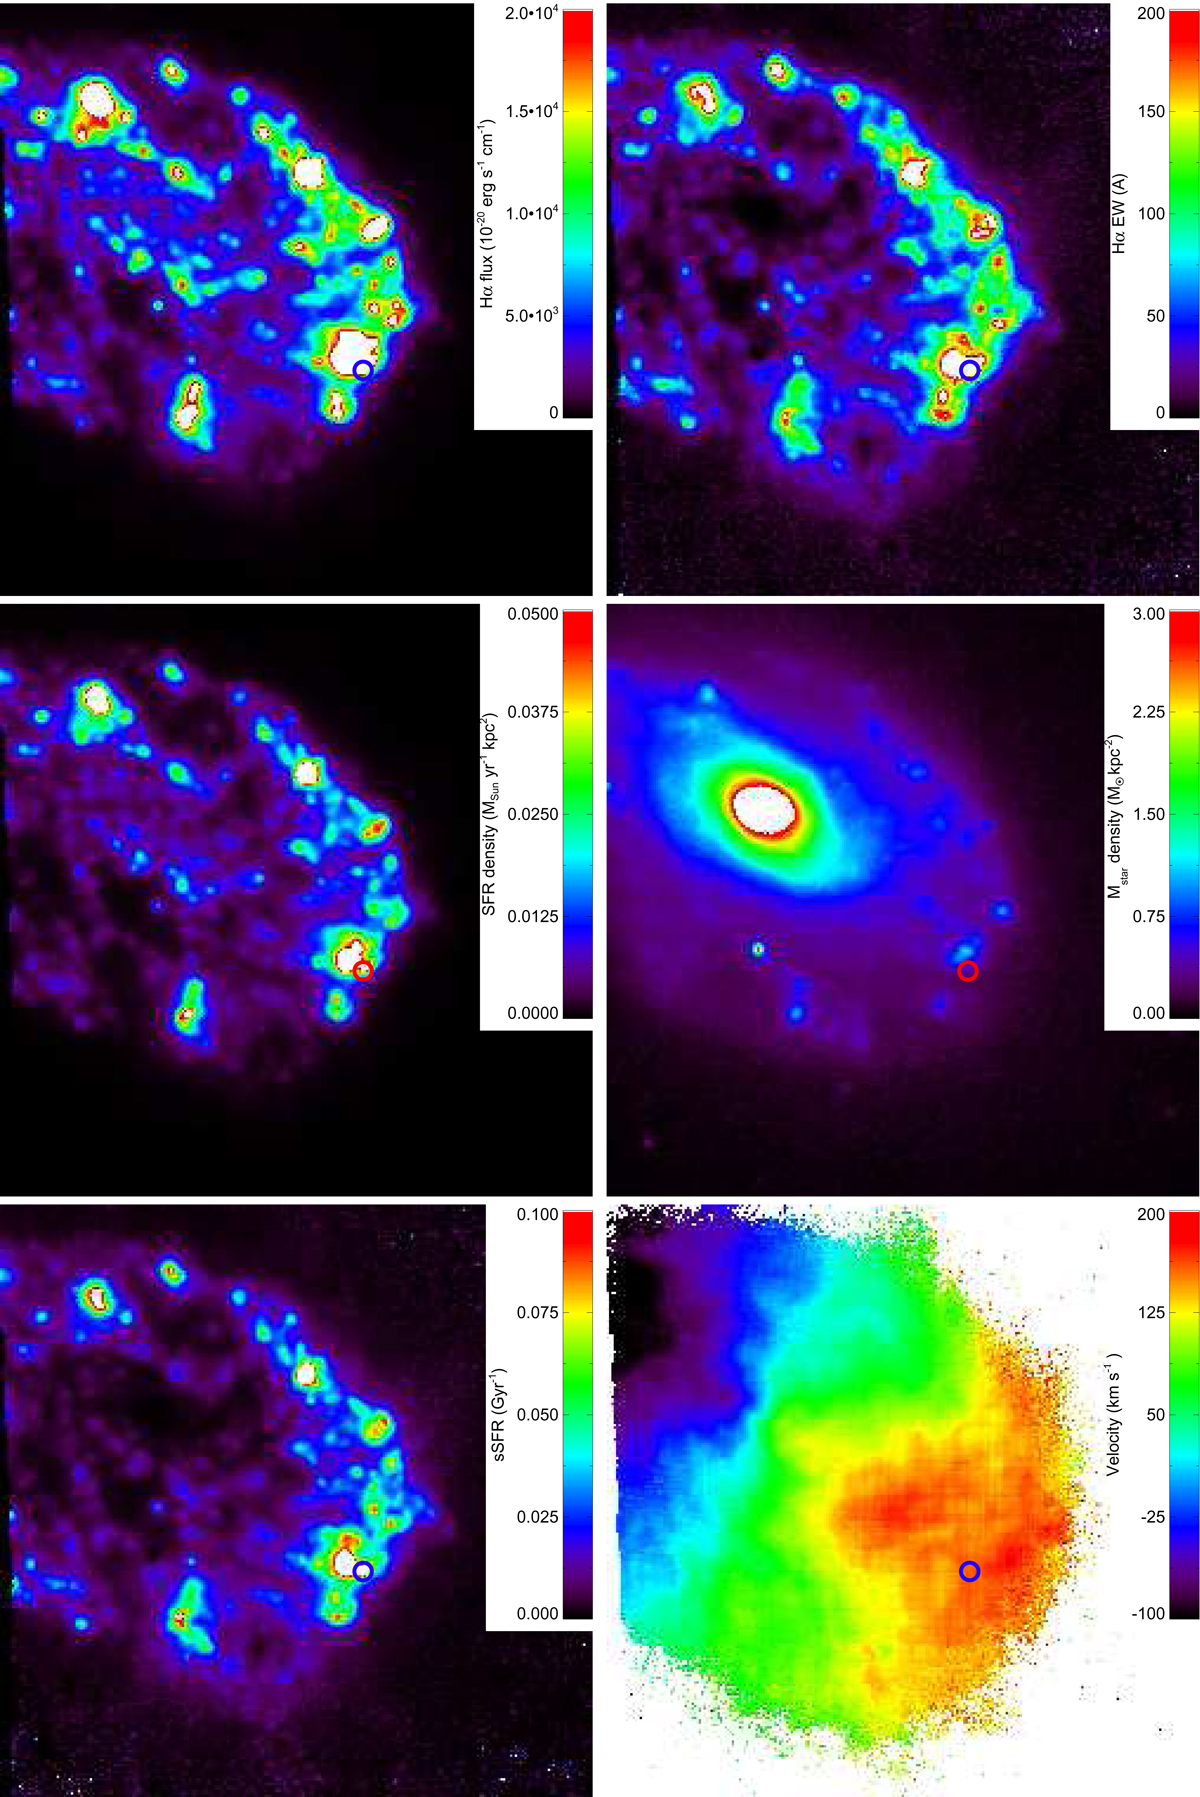
MUSE maps: Hα flux, equivalent width, SFR density from H flux, stellar mass density from H-band, specific SFR, and velocity field. The position of SN 2009bb is indicated by the blue or red circle. The images are 50″ × 50″ (not the entire MUSE coverage). North is up and east is left. White indicates values above the maximum value in the colour bars. The velocities are relative to the systemic velocity of 2961 km s−1.
Current usage metrics show cumulative count of Article Views (full-text article views including HTML views, PDF and ePub downloads, according to the available data) and Abstracts Views on Vision4Press platform.
Data correspond to usage on the plateform after 2015. The current usage metrics is available 48-96 hours after online publication and is updated daily on week days.
Initial download of the metrics may take a while.