Fig. 3.
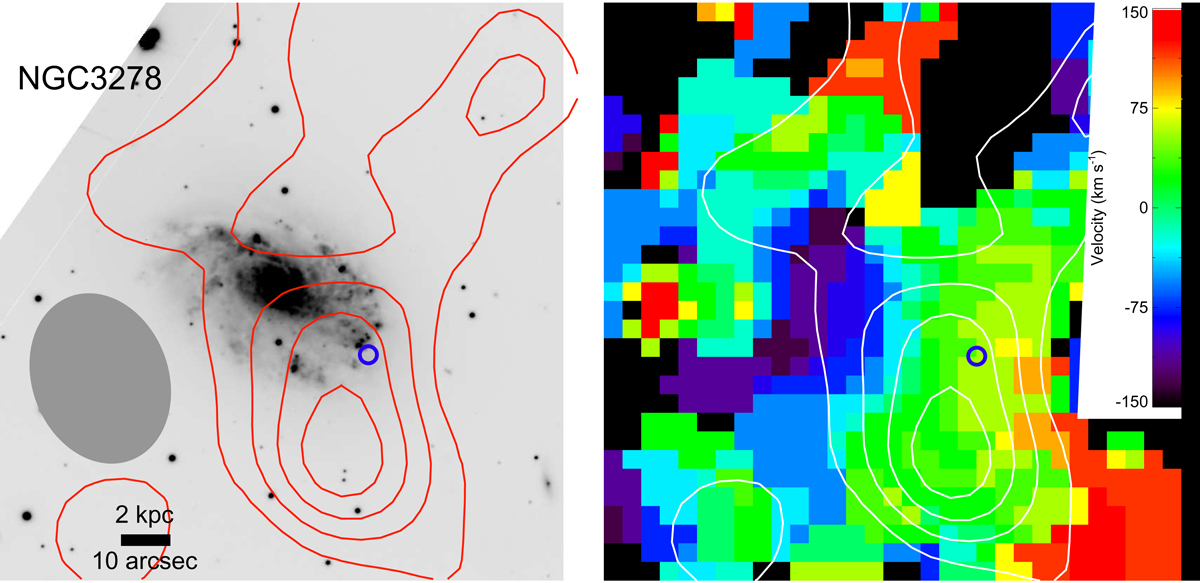
Left: H I contours (red) of NGC 3278 on the optical r-band image of the galaxy (Pignata et al. 2011). The contours are 2, 3, 4, 5σ, where σ = 0.17 Jy beam−1 km s−1 (corresponding to a neutral hydrogen column density of ~1.9 × 1020 cm2) is the rms of the collapsed image. The position of SN 2009bb is indicated by the blue circle. H I is concentrated close to this position. The beam size of the H I data is shown as the grey ellipse. The image is 120″ × 120″ and the scale is indicated by the ruler. North is up and east is left. Right: the first moment map (velocity field) of the H I line. The image has the same size as the left one and the same contours and the SN position are shown. The velocities are relative to the systemic velocity of 2961 km s−1 derived from optical spectra.
Current usage metrics show cumulative count of Article Views (full-text article views including HTML views, PDF and ePub downloads, according to the available data) and Abstracts Views on Vision4Press platform.
Data correspond to usage on the plateform after 2015. The current usage metrics is available 48-96 hours after online publication and is updated daily on week days.
Initial download of the metrics may take a while.