Fig. 9.
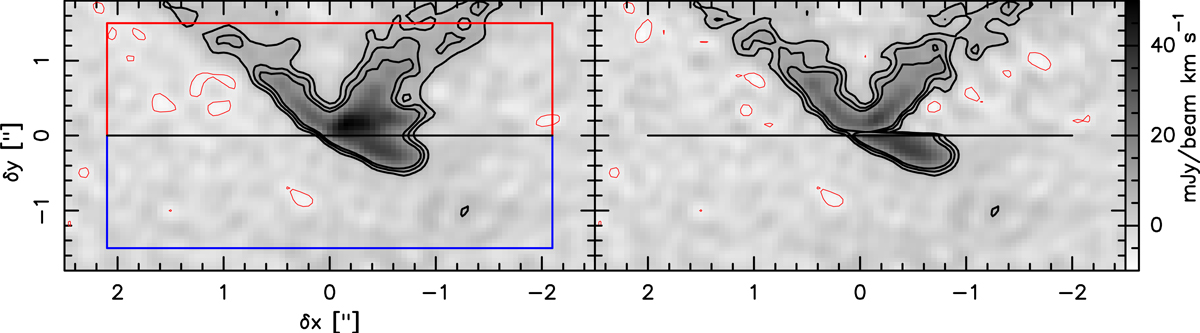
Illustration of the disk emission subtraction in the northern hemisphere. Left panel: 12CO emission of HH30 at 9.6 km s−1 before subtraction of the disk contribution. Right panel: same channel after subtraction of the southern emission (blue rectangle on the left panel) from the northern emission (red rectangle on the left panel). The black contours show the +3σ, +5σ, and +7σ levels, while the red contours outline negative contours at −3σ, −5σ, and −7σ with σ = 2.0 mJy beam−1 km s−1.
Current usage metrics show cumulative count of Article Views (full-text article views including HTML views, PDF and ePub downloads, according to the available data) and Abstracts Views on Vision4Press platform.
Data correspond to usage on the plateform after 2015. The current usage metrics is available 48-96 hours after online publication and is updated daily on week days.
Initial download of the metrics may take a while.