Fig. 7.
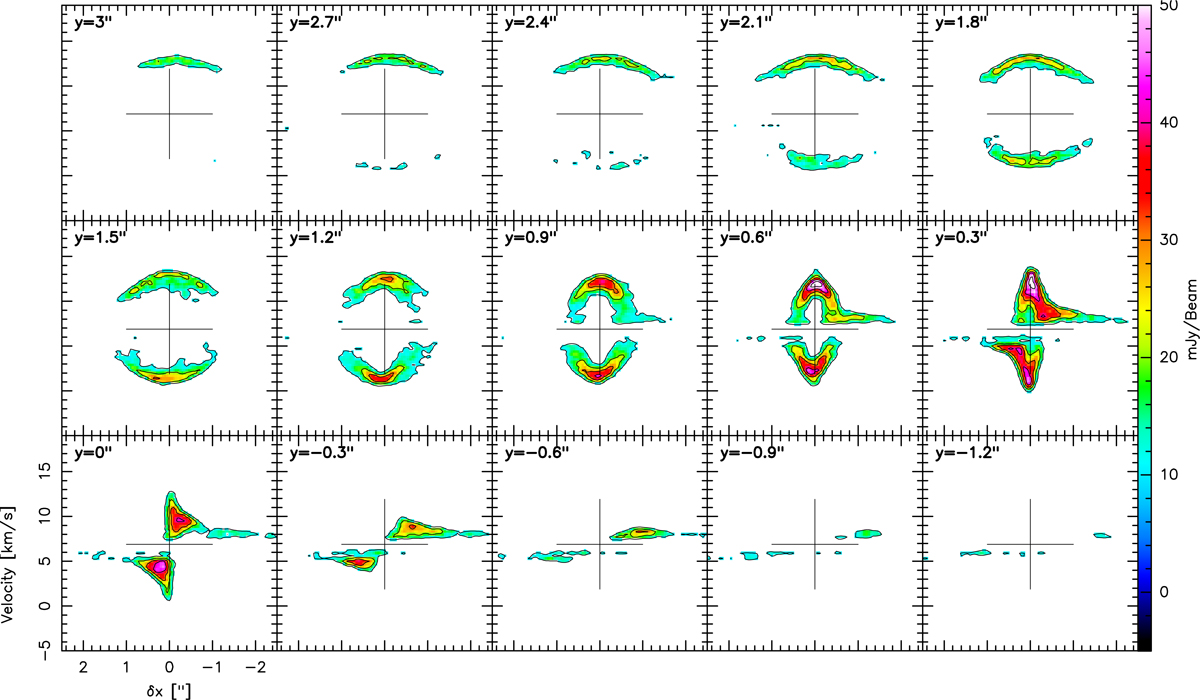
Transverse pv diagrams of the 12CO(2–1) emission, with pseudo-slit parallel to the disk main axis, from y = +3″ on the top left to y = −1.2″ on the bottom right. Signatures of the Keplerian disk dominate for y < 0.3″ while elliptical signatures of the CO cavity/outflow appear at y > 0.3″. The black cross shows the central x = 0″ position and source vlsr at 6.9 km s−1. The contour levels start at 5σ with 5σ steps with σ = 2.0 mJy beam−1.
Current usage metrics show cumulative count of Article Views (full-text article views including HTML views, PDF and ePub downloads, according to the available data) and Abstracts Views on Vision4Press platform.
Data correspond to usage on the plateform after 2015. The current usage metrics is available 48-96 hours after online publication and is updated daily on week days.
Initial download of the metrics may take a while.