Fig. 5.
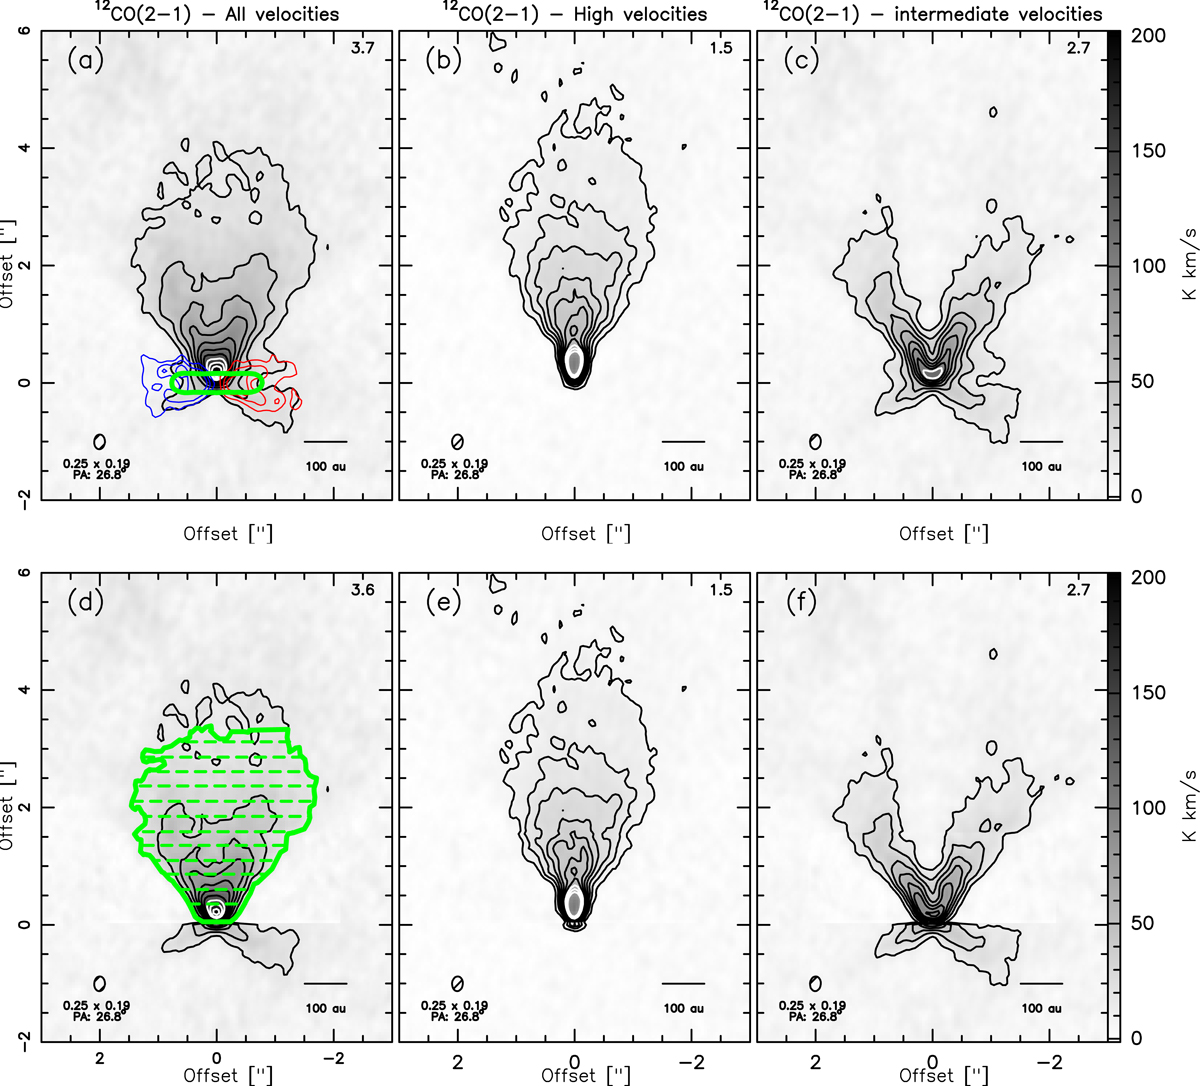
Panel a: moment 0 of the 12CO(2–1) emission, integrated over the full range of emission from −0.1 km s−1 to 14 km s−1. The blue and red contours highlight the blue-shifted and red-shifted 13CO(2–1) emission line arising from the disk. Panel b: 12CO emission integrated at high velocities from −0.1 km s−1 to 2.3 km s−1 and from 11.3 km s−1 to 14 km s−1. At these velocities, only the outflow contributes to the 12CO emission. Panel c: 12CO emission integrated over intermediate velocities from 2.6 km s−1 to 11 km s−1. At those velocities, the 12CO emission is a mixture of emissions arising from the outflow and from the disk. Bottom panels: same as the top panels, after subtraction of the emission arising from the disk in the northern hemisphere (see Sect. 4.1). Panel d: the thick green contour defines the area used to derive the mass of the outflow (see Sect. 4.2). Together with the green horizontal lines, it defines the 13 regions used to construct the temperature brightness profile along the flow shown in Fig. 10. In all panels the contours start at 5σ with 5σ steps. The 1σ value is indicated on the top right corner of each panel in the unit K km s−1.
Current usage metrics show cumulative count of Article Views (full-text article views including HTML views, PDF and ePub downloads, according to the available data) and Abstracts Views on Vision4Press platform.
Data correspond to usage on the plateform after 2015. The current usage metrics is available 48-96 hours after online publication and is updated daily on week days.
Initial download of the metrics may take a while.